Advertisement

MCX Nickel technical analysis chart updated on 30th April 2015, Thursday.


MCX Nickel moving up from support zone as shown in above graph, technical indicates bulls will be favored as long as it holds above its support zone.
On upper side Nickel can see further price rise once it closes and holds above its trend line resistance as shown in above image.

MCX NATURAL GAS Chart is indicating strong resistance - Chart updated on 30th April 2015, Thursday.


MCX Natural gas moving up from strong trend line support zone as shown in technical chart but currently finding 50 days moving average at current levels, further strength expecting once it closes and holds above its 50 DMA.
Even its major trend indicator "MACD" is indicating positive signal, if it breaks 50 DMA then further price rise can be seen. Visit link for free mcx technical chart.

USD EUR currency forecast - technical chart updated on 30th April 2015, Thursday.


USD EUR


USD EUR closed below its golden ratio support zone, technical indicates currency can tests its previous bottom as long as it holds below its golden ratio support zone.
Even currency major trend indicator is trading in -ve zone as well as level zero, further weakness can be seen in coming days. Visit link for more forecast on currency on daily bases.

DOW JONES finding resistance - US Stock market chart updated on 30th April 2015, Thursday.


DOW JONES INDUSTRIAL AVERAGE


Dow Jones Index moving up from 100 DMA but now on upper side index is finding strong trend line resistance at current levels, technical indicates as long as us stock market dow index holds above 100 DMA and trading below its trend line trend will not be clear but once it closes and holds above its trend line resistance then further price rise is expecting in coming days.

Even stock major trend indicator "MACD" is moving in positive zone this indicates bulls will be favored once it closes above its trend line.

HINDUSTAN UNILEVER finding strong support at current levels - Stock chart updated on 29th April 2015, Wednesday.


HINDUSTAN UNILEVER


Stock finding strong trend line support at current levels (trend line support as well as 200 DMA), technical indicates as if stock closes and holds below its support then further price fall can be seen in coming days but if holds above then bulls will be favored. Visit link for more technical analysis done on equity and on commodities.

Stock was on news - Hindustan Unilever has informed BSE that its meeting of the board of directors will be held on 08th May 2015, for the financial result for year ending 31st March 2015 and also to recommend dividend, if any.

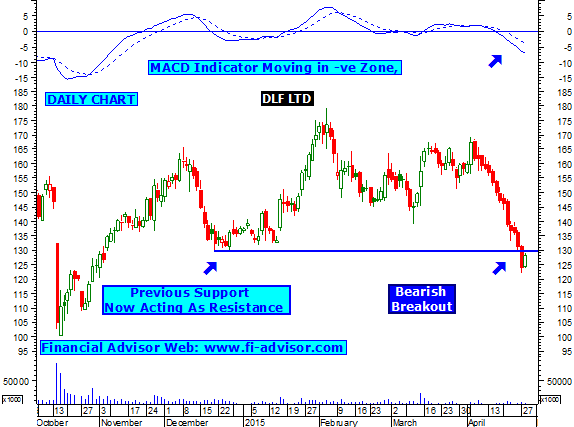
DLF LTD trading below its previous bottom bears will be favored - Technical chart for 29th April 2015, Wednesday


Stock closed below its previous bottom as shown in above graph, technical indicates its previous support is now acting as resistance, so as long as stock holds below its previous bottom bears will be favored and further price fall can be seen in coming days.
Stock major trend indicator "MACD" is moving in -ve zone technical indicated bears will be favored in coming days. Close Watch. Visit our site for more free stock tips.

BANK OF INDIA moving up after forming doji candle formation - Technical chart for 29th April 2015, Wednesday


Stock moving up from golden ratio support zone and also after forming doji candle pattern as shown above in technical chart, as long as stock holds above its golden ratio bulls will be favored and further price rise can be seen in coming days, but once it holds below its recent lows then stock can test its previous bottom which is around 192 levels.

ACC finding strong trend line support at current levels - Technical chart for 29th April 2015, Wednesday


ACC finding strong trend line support at current levels, technical indicates stock is currently moving up, as long as stock holds above its previous support bulls will be favored and further price rise can be seen but once it closes and holds below then weakness expecting. Visit our site for more free share market tips on Indian Stock Market.

NIFTY FUTURES trading below trend line support zone - Technical chart for 29th April 2015, Wednesday.


NIFTY FUTURES


Nifty Futures is now trading below its major trend line support zone, technical indicates as long as it holds below bears will be favored and further price fall can be seen in coming days. Suggested article - What is nifty and what is nifty futures.

RELIANCE CAPITAL finding strong trend line support at current levels - Chart updated on 27th April 2015, Monday.


Stock finding strong trend line support at current levels, technical indicates further price fall can be seen once stock closes and holds below, as long as it holds above stock have some hopes for bounce back.

Stock was on news - Reliance Capital asses management and Samsung asset management both signed agreement that allows both company`s to explore business opportunities and launch funds in each others turf.

For more free stock trading tips visit our site.

NIFTY FUTURES finding strong trend line support at current levels - Chart updated on 27th April 2015, Monday.


NIFTY FUTURES


Nifty Futures finding strong trend line support at current levels, technical indicates as long as it holds above bulls have some scope for bounce back. But once it closes and holds below its trend line support then further price fall can be seen in coming days.

Indian Stock Markets is expected to see huge volatility in coming days as F&O expire in coming Thursday as well as blue chip company like Maruti, ICICI Bank, Sesa sterlite, Idea cellular, AXIS Bank, HDFC and some more will announce its Q3 results and after that on 01st May 2015 Friday is holiday as its Maharastra day.

Overall market trend is seems on down side, domestic investors will be focusing on FII`s and concern over tax issue. Their will be a huge tug of war between bulls and bears in coming days. Markets is also looking for some other political news like land bill and GST in coming days.

AXIS BANK Stock Tips Share witnessing selling pressure from resistance - Updated on 20th April 2015, Monday


AXIS BANK


Stock witnessing selling pressure from fibonacci retracement as shown above, technical indicates bears will be favored as long as it holds below and further price fall can be seen once AXIS Bank closes and holds below its previous bottom as shown in above technical chart.

Visit our site fi-advisor.com for more free stock tips on Indian Stock Market

Stock was on news - Life Insurance Corporation Of India (LIC) buys 0.18% stake in Axis Bank for Rs.243 Cr. The shares are purchased by LIC from open market, company has bought approx 43 lakhs shares during April 13-17 in year 2015 after buying these shares LIC has increased its total stake to 12.4% or 28,55,35,806.

NIFTY FUTURES will find strong trend line support in hourly chart - Updated on 20th April 2015, Monday.


NIFTY FUTURES


As explained in our previous chart nifty futures is witnessing selling pressure from its resistance but close watch hourly chart indicates stock will find strong trend line support if falls further so bulls will now have some hopes for bounce back.

Indian stock market is expecting to open flat as other Asian markets like Nikkei, Hang Seng Index and Shanghai trading in flat zone moreover SGX Nifty is indicating a marginally down side that is -5pts. China also announced a cut in RRR (reserve requirement ratio) but market are not reacting on this news. Click here to read our article on what is Nifty and what is Nifty futures.

NIFTY FUTURES witnessing selling pressure from golden ratio resistance zone - Chart updated on 16th April 2015, Thursday.


NIFTY FUTURES


Nifty futures witnessing selling pressure form golden ratio resistance zone, technical indicates as long as it hold below bears will be favored and further price fall can be seen in coming days. But once Nifty futures closes and holds above then it can test its previous top Click here to read what is nifty and what is nifty futures and you might be interested in reading golden rules of trading in stock market.

Stock market morning update - Indian stock market has opened flat and still moving in a range of  yesterdays close as open giant company`s is expecting to come out with its quarterly result ended 31st March. Today stock market is expecting better result of it giant TCS from its last earning, usually we have seen that its competitor Infosys declare result first then other IT companies declared it and tomorrow (Friday, 17th April) Reliance Industries is coming out with its result so we can expect some action in stock market, stay focus.

Nifty futures is heading to test its strong golden ratio resistance - chart updated on 10th April 2015, Friday.


NIFTY FUTURES


Nifty Futures is on bull move technical indicates nifty futures is now heading to test its golden ratio resistance zone, further strength can be seen once it closes and holds above its golden ratio, till then futures can take some correction, click here to read about what is nifty and what is nifty futures.

Nifty futures was in news today - Nifty futures is likely to open in read today due to release of February IIP data, a CNBC poll sees it inching higher to 3.64% due to favorable base impact.

Among global clues us stock market closes higher after ranging in a narrow zone.

HERO MOTOCORP stuck in a range bound zone - Chart updated on 08th April 2015, Wednesday.


Stock stuck in a range bound zone technical indicates as long as its moving in between its range trend will be mix with no clear direction, stock also finding strong 100 days moving average resistance at current levels. Click here to see technical chart of hero motocorp with auto buy and sell signal.

Stock was on news - Hero motocorp claim Splendor Smart gives max. average globally Hero Motocorp is the India`s second largest two - wheeler marking is working to extend it fuel mileage.

"As per the latest (March, 2015) Fuel Efficiency (FE) values, Splendor iSmart returned a mileage of 102.50 kilometer per litre," a Hero MotoCorp spokesperson said, he also said that it has been certified by iCAT.

Article you might be interested reading - fundamental analysis of stocks. 

Hero new technology i3S automatically shuts down the engine if idling and it can be turned on with a simple press of the clutch, since last year company has sold more that 1 lakh units hence made Slpender largest selling motorcycle in the world, sold approx 2 million units every year.

Ex showroom price around Rs.50000/- delhi. As per financial year 2013-2014 hero motocorp sold 62,45,960 units and in financial year 2014-2105 the numbers are up by 6% sold 66,31,826 units.

Visit our blog daily for intraday shares for tomorrow.

ADITYA BIRLA NUVO is the verge of bullish breakout - Chart updated on 08th April 2015, Wednesday.


ADITYA BIRLA NUVO


Stock finding strong resistance at current levels as shown above, technical indicates further price rise can be seen once stock starts trading above its 100 DMA........ Visit our sire for intraday tips india.

Stock was on news - Aditya Birla group plans mega retail merger via share swap. Pantaloons said it will offer up to 20 per cent of stake in tranches to new financial investors on the expanded capital after the merger is over.

Aditya Birla Retail plan.
  • Madura Garments, More super stores to be merged with Pantaloon Retail
  • Pantaloon to offer 20% stake on the expanded capital of the merged entity
  • Birlas not to vote voluntarily at Pantaloons' extraordinary general meeting on preferential allotment to new investors
  • Each investor to get one seat on the board of Pantaloon.
  • No veto power to any private-equity investor on the Pantaloon board
  • Work on valuation and swap ratio going on.
Visit our blog daily for tomorrow share market intraday tips.

NIFTY FUTURES has formed dojij candle formation in daily charts - updated on 08th April 2015, Wednesday.


NIFTY FUTURES


Nifty futures has formed doji candle formation in daily charts, technical indicates sharp movement is expecting once Nifty Futures starts trading above its yesterday high.
You might be interested in reading article - nifty guide.

Visit our blog daily for Best shares to buy tomorrow for intraday.

AMAZON (AMZN) Us Stock Market Forecast - Chart updated on 07th April 2015, Tuesday.


AMAZON (AMZN)


Stock moving up from strong support zone as shown above, technical indicates as long as it holds above its support bulls will be favored and further price rise can be seen in coming days.


Click here for more free analysis on stock listed on Us Stock Market.

JPY INR Currency trading tips india - Chart updated on 07th April 2015, Tuesday.


Currency stuck in a range bound zone, technical indicates sharp movement expecting once it comes out from its pattern. Visit our site for more currency trading tips India.

AUROBINDO PHARMA Stock Trading Tips - Chart updated on 07th April 2015, Tuesday.


Stock closed above its previous top, technical indicates stock will favor bulls as long as it holds above its previous top.


Stock was on news - Aurobindo Pharma stock gained 6.5% on USFDA nod to manufacture and market Sildenafil injection, use for treating pulmonary arterial hypertension in the american market, stock made a 52 weeks high in Indian share market, at NSE stock close around 1328. The company product is a genetic version of Pfizers Revatio injection.

ADANI POWER Stock tips , Chart updated on 05th April 2015, Sunday.


ADANI POWER


Stock finding strong trend line support zone at current levels, technical indicates as long as it holds above bulls will be favored and further price rise can be seen in coming days. Even stock major trend indicator moving in +ve zone this will favor bulls. Click here to more free share market tips.

TATA CHEMICALS LIMITED Stock Tips , Chart updated on 05th April 2015, Sunday.


TATA CHEMICALS LIMITED


Stock finding strong resistance at current levels, as long as holds below bears will be favored. Once stock closes and holds above its resistance then further price rise can be seen in coming days.

SUN PHARMA stock tips , Chart updated on 05th April 2015, Sunday.


Stock has formed bullish candle pattern in daily charts, technical chart indicates as long as stock holds above its previous top (trend line) bulls will be favored and further price rise can be seen in coming days. Click link to see more free technical charts on stock market,

SESA STERLITE Stock Tips , Chart updated on 05th April 2015, Sunday.


Stock finding strong trend line support zone will favor bulls as long as it holds above, stock major trend indicator turning +ve, close watch. Click here for more stock tips on Indian Stock Market.

Advertisement

What is Intraday Tips ?

Q. What is Intraday Tips / Inraday Trading / Delivery trading.

A. There are basically two types of trading on stock market--
1- Delivery
2- Intraday

Delivery trading is one in which shares are bought and can only be sold after they are delivered by the broker.that means that they cannot be sold the same day , and delivery takes two to three days after they are bought and then they are ready to be sold.

Intraday trading which takes place for that very particular day and there is no delivery..they can be bought and sold the same day...and are automatically sold at the end of the trading session if you have not sold it by yourself during the trading session. The person who suggest such types of forecast is called

Intraday Tips

.