Advertisement

MCX ALUMINIUM closed below golden ratio support zone, further weakness can be seen.


MCX ALUMINIUM
Charts updated for - 23rd February 2015.


  • Aluminium closed below its golden ratio support zone @ 112, chart indicates bears will be favored as long as it holds below 112, if falls further then it will find next strong support around 109. Close Watch.
  • MCX stock charts.

PM Modi’s Monogrammed Suit Was Auctioned Off with a whopping price tag of Rs 4.31 crore


PM Modi’s Monogrammed Suit Was Auctioned Off with a whopping price tag of Rs 4.31 crore.
The three-day bidding war for PM Modi's outrageous monogrammed suit came to a close on February 20. Narendra Modi's monogrammed bandhgala suit that drew trenchant criticism from rivals was sold off for a staggering Rs 4.31 crore. It turned out that the same suit had quite a few fans. Diamond merchant, Hitesh Laljibhai Patel, included

The entire suit and pant had Narendra Damodardas Modi repeatedly embroidered into the fabric and is believed to be worth Rs 10 lakh. The money generated from the auction will go for Modi's ambitious 'Clean Ganga Mission'. He wore during US President Barack Obama’s visit to India last month

An auction in perhaps the first such sale of articles gifted to a serving Prime Minister.

Stock market to remain open on 28th February 2015 on occasion of budget day.

Stock market to remain open on budget day 28th February 2015 (Saturday) when our. Finance Minister Arun Jaitley will present the Union Budget. As per market regulator SEBI, exchanges - BSE and NSE confirmed this on late evening 20th Feb 15, saying a live session would be held as per regular trading hours.

In past years market remained open when the Budget speech is read in the Parliament. In year 2000, when the Budget speech took place at 5 pm in the evening, exchanges were re-open markets for a special trading session.
For complete list of trading holidays for year 2015.

USDINR finding strong resistance at current levels.


USD INR
Charts updated for - 23rd February 2015.


UNITECH moving up from strong trend line support zone, bulls will be favored as long as holds above.


UNITECH
Charts updated on - 23rd February 2015.


  • Stock moving up from strong trend line support zone, chart indicates as long as stock holds above bulls will be favored.
  • Further price fall can be seen once Unitech closes and holds below 15.45.
  • On upper side bull rally can be seen once stock closes and holds above 19.90 (its previous top).
  • Click here for trading ideas on Suzlon Energy.

SUZLON ENERGY correcting after touching strong trend line resistance around 27.50.


SUZlON ENERGY
Charts updated on - 23rd February 2015.


  • Stock currently witnessing selling pressure from its trend line resistance zone, further correction can be seen as long as Suzlon holds below 27.50. Close Watch.
  • SBI Stock Tips.

SBI witnessing selling pressure from resistance zone @ 313.


STATE BANK OF INDIA (SBI)
Charts updated for - 23rd February 2015.


  • Stock currently coming down from resistance zone @ 313, technical indicates as long as SBI holds above below 313 bears will be favored. Further price rise can be seen once stock closes and holds above 313.
  • Share Market Tips.

RELIANCE POWER closed above its golden ratio, further price rise can be seen in coming days.


RELIANCE POWER
Charts updated on - 23rd February 2015.


  • Stock closed above its golden ratio, further price rise can be seen as long as it holds above 62.25, upper side will now find strong resistance around 67 its previous top.
  • Stock Analysis On Reliance Infra.

RELIANCE INFRA Will be finding strong golden ratio resistance around 476.


RELIANCE INFRA
Charts updated on - 23rd February 2015.


  • Stock moving up from strong support, close watch Reliance Infra will now be finding strong resistance around 476 (as shown above). Further price rise can be seen once stock closes and holds above.
  • Stock Tips On DLF.

RELIANCE COMMUNICATIONS witnessing selling pressure from golden ratio.


RELIANCE COMMUNICATIONS
Charts updated on - 23rd February 2015.


RELIANCE CAPITAL finding strong golden ratio resistance at current levels, will favor bulls once it closes and holds above.


RELIANCE CAPITAL
Charts updated on - 23rd February 2015.


RELIANCE INDS witnessing selling pressure will now find strong support around 862.


RELIANCE INDUSTRIES
Charts updated on - 23rd February 2015.


  • Stock has shown sharp selling after breaking its support (as shown in previous chart of Reliance Inds).
  • Technical indicates stock looking weak and down side will find strong trend line support around 862 and 831 (its previous bottom).
  • Stock tips on Reliance Capital.

ICICI BANK witnessing selling pressure from resistance zone, further weakness can be seen in coming days.


ICICI BANK
Charts updated on - 23rd February 2015.


  • Stock currently coming down from 38.2% fibonacci retracement resistance zone, chart indicates as long as it holds below further price fall can be seen in coming days.
  • On down side ICICI Bank will find strong support around 316.50 its recent bottom.
  • Tips on shares.

HDIL moving up from support @ 114, further price rise can be seen as long as holds above 114.


HDIL
Charts updated on - 23rd February 2015.


  • Stock moving up from strong trend line support zone @ 114 as shown above. Chart indicates as long as HDIL holds above its previous resistance @ 114 bulls will be favored and further price rise can be seen in coming days.
  • Free stock tips.
  • Wold Index Charts.

DLF moving up from golden ratio and 50 DMA support zone @ 148, bulls will be favored.


DLF LTD
Charts updated on - 23rd February 2015.


  • DLF moving up from 50 days moving average and golden ratio support zone @ 148, chart indicates as long as stock holds above bulls will be favored and further price rise can be seen in coming days.
  • Weakness expecting once DLF closes and holds below 148. Close Watch.
  • Suggested article - Stock market myths.
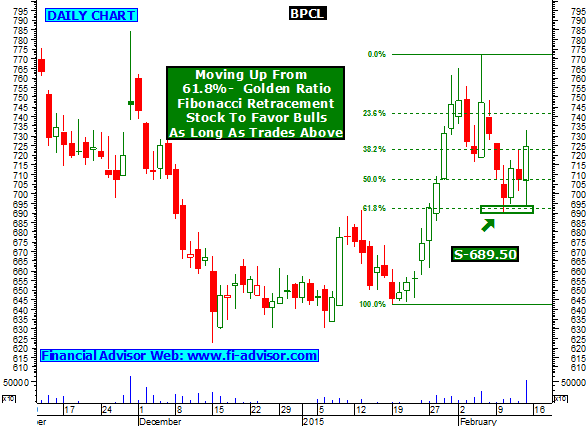
  • BPCL stock analysis.

BPCL moving up from golden ratio support zone, will favor bulls as long as holds above 689.50.


BPCL
Charts updated on - 23rd February 2015.


  • Stock moving up from strong golden ratio support zone as shown above, this indicates as long as BPCL holds above 689.50 bulls will be favored and further price rise can be seen.
  • We can see some weakness in BPCL once stock closes and holds below 689.50. Close Watch.

ASHOK LEYLAND coming down after doji candle formation in daily chart.


ASHOK LEYLAND
Charts updated on - 20th February 2015.


  • Stock witnessing selling pressure after forming doji candle pattern. Further weakness can be seen in coming days.
  • If Ashok Leyland falls further then stock will find strong support around 67.50, 65.50, 63.70 & 62. Close Watch.
  • Stock Tips.


APOLLO TYRES will find strong support around 176.50.


APOLLO TYRES
Charts updated on - 23rd February 2015.


  • Stock finding strong support around 176.50, chart indicates further price fall can be seen once Apollo tyres closes and starts trading below 176.50. Close Watch.
  • Trading forecast On Bank Nifty Index.

BANK NIFTY INDEX witnessing selling pressure from 50% fibonacci retracement


BANK NIFTY CHART
Charts updated for - 23rd February 2015.


  • Bank Nifty Index currently witnessing selling pressure from 50% fibonacci retracement resistance around 19580, technical charts indicates further strength can be seen once Index closes and holds above 50% fibonacci retracement. Close Watch.
  • Technical Analysis On Nifty Futures.

NIFTY FUTURE holding above golden ratio, will favor bulls as long as it holds above 8827.


NIFTY FUTURE CHART ANALYSIS
Charts updated On - 23rd February 2015.


  • Nifty Futures holding above golden ratio resistance zone, chart indicates as long as it holds above 8827 bulls will be favored on upper side will find strong resistance around 9030.
  • Click here to read article on golden rules on stock market trading.
  • Tips On share market.

Advertisement

What is Intraday Tips ?

Q. What is Intraday Tips / Inraday Trading / Delivery trading.

A. There are basically two types of trading on stock market--
1- Delivery
2- Intraday

Delivery trading is one in which shares are bought and can only be sold after they are delivered by the broker.that means that they cannot be sold the same day , and delivery takes two to three days after they are bought and then they are ready to be sold.

Intraday trading which takes place for that very particular day and there is no delivery..they can be bought and sold the same day...and are automatically sold at the end of the trading session if you have not sold it by yourself during the trading session. The person who suggest such types of forecast is called

Intraday Tips

.