Advertisement

Showing posts with label acc ltd. Show all posts

ACC Ltd share market tips and stock trading tips updated for 18th March 2016, Friday.


ACC finding strong trend line resistance around 1288, technical indicates bulls action can be seen once stock closes and holds above 1288.

As long as it holds below trend will be mix. Intraday bulls action can be seen once stock holds above 1288.

ACC Ltd stock tips, share market tips, free technical analysis chart, nse intraday tips for tomorrow - Stock finding strong trend line support in daily chart, forecast updated for 11th December 2015, Friday.


ACC LTD


Technical graph 1 indicates that stock is finding strong trend line support at current levels as long as it holds above bulls will be favoured and further bulls action can be seen in coming days, weakness can be seen once stock closes and holds below 1305 in daily chart.

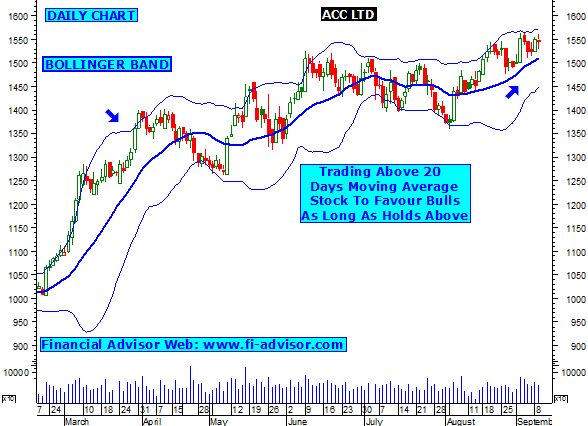
Technical chart no.2 indicates that ACC has formed triangle pattern in daily chart as long as it holds in between trend will be mix with no clear direction, sharp movement is expecting once it comes out from its pattern on either ways.

Weekly chart no3 indicates that stock is witnessing selling pressure from 50 weekly moving average this indicates short-long term traders will be favoured as long as stock holds below 20 weeks moving average.


Intraday weakness can be seen in ACC once it holds below 1305, if stays below then stock will find support around 1290, 1280.

Visit link to read more stock tips.

ACC Ltd free stock tips and technical chart updated on 19th October 2015, Monday.


Stock moving in a range bound zone, technical indicates bulls action can be see once it closes and holds above its range @ 1408. It is also finding strong 100 DMA resistance at current levels.

Intraday bulls action can be seen once it closes and holds above 1408. Will find resistance around 1422,1430.

ACC Ltd free intraday trading tips and stock tips updated for 18th September 2015, Friday.


ACC finding strong trend line resistance at current levels @ 1400. Technical indicates ACC LTD can see some bulls action once it closes and holds above its resistance zone @ 1400. Till then stock can see some bearish action.

Free intraday trading tips updated for 18th September 2015, Friday.

ACC looks good above 1400.
Will find resistance around 1420, 1432.

ACC Ltd stock trading tips updated for 01st September 2015, Tuesday.


ACC finding strong trend line support at current levels, technical indicates stock can see some weakness once it closes and holds below its trend line support zone @ 1302.

Free intraday trading tips updated for 01st September 2015, Tuesday.

ACC looks weak below 1320.
Will find support around 1302, 1290.
S.L 1328.

ACC Ltd free stock tips and trading forecast updated for 13th August 2015, Thursday.


ACC finding strong trend line support at current levels @ 1350, bears action can be seen once stock closes and holds below 1350.

Free intraday tips updated for 13th August 2015, Thursday.

Intraday Acc looks weak below 1350.
Will find support around 1332, 1320.
Use S.L 1360.

ACC limited technical analysis chart updated on 15th July 2015, Wednesday.


ACC finding strong trend line resistance at current levels, further bulls action can be seen in ACC once it closes and holds above 1516.

Free intraday tips updated for 16th July 2015, Thursday.

Intraday ACC looks good above 1516.
Resistance around 1533, 1550.
S.L 1505.

Suggested reading article on Stock trading advice.

ACC finding strong trend line support at current levels - Technical chart for 29th April 2015, Wednesday


ACC finding strong trend line support at current levels, technical indicates stock is currently moving up, as long as stock holds above its previous support bulls will be favored and further price rise can be seen but once it closes and holds below then weakness expecting. Visit our site for more free share market tips on Indian Stock Market.

ACC LTD Stock chart for tomorrow - Chart Updated On 02nd April 2015, Thursday.


Stock finding strong trend line support at current levels technical indicates price rise can be seen in ACC as long as it holds above its support zone, even stock major trend indicator turned positive this will favor bulls.

ACC LTD has formed double bottom formation.


ACC LTD


  • Stock has formed double bottom formation in daily chart, this indicates once stock comes out from formation then sharp movement can be seen.
  • Currently ACC is holding below 200 DMA, as long as holds below bears will be favored.
  • Technical indicates once closes and holds below 1354 then further price fall can be seen. Close Watch.
  • Suggested Article - What is stop loss in stock market trading.

ACC LTD Intraday stock tips


ACC LTD


  • Stock facing strong trend line support @ 1354, will favor bears once stock closes and holds below 1354.
  • As per weekly chart stock is moving in range bound zone, this indicates once ACC comes out from its range then sharp movement is expecting, upper side will find resistance around 1570 and down side support around 1354.
  • Even stock major indicator "MACD" and "Stochastic Oscillator" is moving in -ve and also stock trading below 200 DMA this indicates further price fall can be seen in coming days.

ACC LTD Share Tips, Technical Analysis Chart, Intraday Stock Trading Graph Advice - Stock facing strong trend line resistance at current levels, further strength expecting once ACC closes above 1565. (Updated on 10th August 2014, Wednesday).


ACC LTD


  • As per previous report published on ACC LTD, stock gave a false breakout after breaking its resistance @ 1545, stock closed above 1545 and after that made a high around 1565 and again came down. (Click here to see previous report published on ACC LTD).
  • Now as per current stock analysis chart no1, stock is facing strong trend line resistance around 1565, this indicates as long as stock trades below bears can get active, but once ACC closes above 1565 and holds above then bull will have strong hands once again in ACC and stock can move up further for few trading days.
    • Intraday trading tips - Close watch once stock starts trading above 1565, if holds above 1565 during Indian stock market hours then intraday bulls action is expecting.
  • As per graph no2, ACC is holding above 20 days moving average , as long as stock holds above 20 DMA bulls will ve favored ,but once ACC close below 20 DMA stock will show first sign of weakness.
  • As per chart no3, stock major trend indicator "MACD" is moving in +ve zone and also above level zero, as long a MACD positive this will show ACC can see some higher price. If ACC moves up from current levels then stock will find next strong resistance around 1625 its 161.8% fibonacci retracement, close watch.
  • Click here to see all the free trading reports (tips) published by us on ACC LTD.
  • Free share market trading tips.

ACC LTD Share Tips, Technical Analysis Chart, Intraday Stock Trading Graph Advice - Stock facing strong resistance at current levels, Strength expecting in ACC once it closes above 1545. (Updated for 25th August 2014, Monday).


ACC LTD


  • As per previous report published on ACC LTD , stock gave sharp up move after breaking its resistance 1500, 1510 and 1525 as mention in out previous report and so far share made a high around 1545. (Click here to see previous report published on ACC LTD.
  • Now daily chart indicates that stock was earlier moving in a down channel patterns and made a bullish breakout, but failed to close above its previous resistance @ 1525 but after breaking 1525, made a intraday high @ 1545. Technical charts indicate that once ACC closes and stays above 1545 then looking bullish for next few trading days.
    • Intraday close watch once stock starts trading above 1545, if holds above 1545 then intraday bulls action is expecting in ACC Ltd.
  • As per graph no2, stock is showing small weak signals as per candlestick studies. But once stock closes above its candel @ 1545 then it will favor bulls. Close Watch.
  • As per graph no3, once ACC moves up from current level and holds above its resistance then will find next strong resistance around 1620 as per 161.8%  fibonacci retracement. Even stock major trend indicator "MACD" is moving in +ve zone and above level zero this indicates stock can move up.
  • Click here to see all the free trading reports (tips) published by us on ACC LTD.
  • Visit our blog for Free Tips On Share Market we update fresh recommendation after every 3 hours :-).

ACC LTD Share Tips, Technical Analysis Chart, Intraday Stock Trading Graph Advice - Stock moving in a down channel formation, sharp move expecting when ACC come out from its formation. (Updated on 13th August 2014, Wednesday).


ACC LTD


  • As per previous report published on ACC , Stock failed to show weakness after breaking its major support, and stock bounced back. (Click here to see previous report published on ACC LTD).
  • Now daily chart indicates stock is moving in a down channel formation, but once stock comes out from its down pattern then sharp move is expecting in ACC LTD. On upper side stock will test its strong trend line resistance around 1500, 1510 and 1525. Sharp bull move is expecting once ACC closes and stays above 1525, as shown in graph no1.
  • As per graph no 2 , stock gave a fake bearish breakout by closing below its 23.6% fibonacci retracement support and then bounced back. This indicates as long as stock holds above it will be favored by bulls.
  • Technical also indicates stock is trading above its 50 days moving average as long as stock holds its 50 DMA it will be favored by bulls, moreover stock major trend indicator "MACD" just turned positive, this indicates ACC to show show some strength as long as macd holds in positive zone. Close Watch.
  • Click here to see all the free trading reports (tips) published by us on ACC LTD.
  • Free Tips On Share Market.

ACC Share Tips, Technical Analysis Chart, Stock trading - ACC LTD facing strong support at current levels , Further weakness expecting if ACC closes below 1388. (Updated On 31st July 2014, Thursday).


  • Daily chart indicates stock is moving in a down channel formation and currently facing strong support at current levels, if stock breaks is formation then sharp move is expecting. Close Watch.
  • Daily chart also indicates stock is currently facing strong trend lines and 23.6% fibonacci retracement support around 1388, if closes and stays below then further Weakness is expecting in ACC, and will find strong support around 38.2 % fibonacci retracement around 1320.
    • Intraday close watch once ACC starts trading below 1388. If stays below with volumes then bears to get active and can see intraday weakness.
  • Chart also indicates stock was holding its 100 days moving average support as shown above in chart no.3. Now stock has closed below its moving average which indicates stock can see further weakness. Close Watch.
  • Click here to see all the reports (tips) published by us on ACC LTD (as per technical analysis point of view).
  • Tips On Share


Advertisement

What is Intraday Tips ?

Q. What is Intraday Tips / Inraday Trading / Delivery trading.

A. There are basically two types of trading on stock market--
1- Delivery
2- Intraday

Delivery trading is one in which shares are bought and can only be sold after they are delivered by the broker.that means that they cannot be sold the same day , and delivery takes two to three days after they are bought and then they are ready to be sold.

Intraday trading which takes place for that very particular day and there is no delivery..they can be bought and sold the same day...and are automatically sold at the end of the trading session if you have not sold it by yourself during the trading session. The person who suggest such types of forecast is called

Intraday Tips

.