Advertisement

EXIDE INDS Share Tips, Technical Analysis Chart, Intraday Stock Trading Graph Advice - Stock moving in up channel pattern and took 50 DMA support , further strength expecting once closes above 172. (Updated on 03rd September 2014, Wednesday).


EXIDE INDS


  • As per previous report published on EXIDE INDS, stock failed to closed above its trend line resitance @ 170, but after breaking its resistance gave intraday Rs.2 up move and made a high around 172 and then closed below. (Click here to see previous report published on EXIDE INDS).
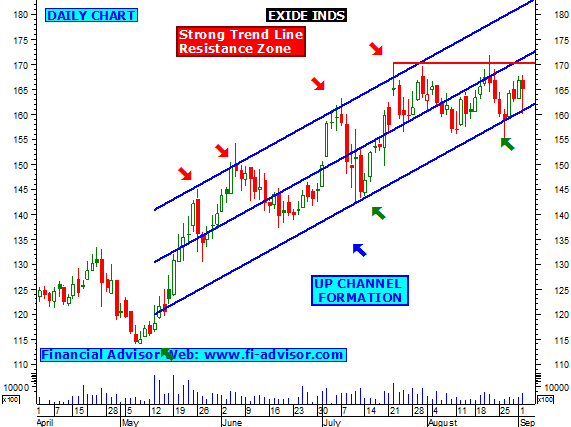
  • Now current charts indicates that stock is still moving in a up channel formation, will favor bulls as long as it moves in its channel formation, bears will have a grip once it comes out from up pattern. On upper side Exide will be facing trend line resistance around 172, once Exide closes and holds above 172 then bull will take it further up for next few trading days.
  • As per technical stock analysis, graph no2, 50 days moving averge is playing a imp. role in Exide Inds, as long as stock holds above 50 DMA it will be favored by bulls, But when stock closes below 50 DMA then will give first sign of weakness. On upper side watch out for resistance @ 172.
  • According to Graph no3, if stock moves up from current levels and closes and holds above 172 then bulls will be active and they will find next strong resistance @ 181 its 161.8% fibonacci retracement.
  • As per weekly chart shown in image 4, last week Exide has formed doji, usually it indicates change of trend and sharp move. Close Watch @ 172, if breaks it nearest resistance we can see some action.
  • Click here to see all the free trading reports (tips) published by us on EXIDE INDS.
  • Stock markert tips for tomorrow.

SBIN Share Tips, Technical Analysis Chart, Intraday Stock Trading Graph Advice - Stock is moving in down channel formation, and moving up from 100 DMA , will favor bulls once SBIN closes above 2577 (Updated on 03rd September 2014, Wednesday).


STATE BANK OF INDIA (SBIN)


  • SBIN is currently moving in a down channel formation, usually it indicates stock to favor bears as long as it trades in between in down pattern, but as per current technical analysis studies stock is now trying to break its up channel pattern as shown in chart no1, close watch once stock breaks and closes above 2577 in SBIN then bulls may get active and further strength is expecting.
    • Intraday tips - close watch if sbin starts trading above 2577 during market hours , if holds above 2577 then intraday bulls action is expecting.
    • Suggested Article - What is stock exchange.
  • According to graph no2, SBIN is moving up from 100 days moving average, it will favor bulls as long sbin holds above 2577, and bulls may extrend their gain if stock closes above its down channel formation.
  • If stock moved up from current levels then SBIN will find strong trend line resistance around 2620, 2730, 2760 and 2834, as shown in graph no3. Close Watch.
  • Stock was on news on 02nd Sep 14 - The Finance Ministry has urged RBI to tighten the norms and monitoring system so that activities like fund diversion could be prevented.
    • Kingfisher Airlines allegedly diverted funds by opening a current account in HDFC Bank and had a balance of Rs. 7.5 crore as of date.
    • This fact was not known to the consortium of lenders headed by State Bank of India. These banks have an outstanding debt of Rs. 6,521 crore from the now-grounded carrier, Source: Moneycontol
  • Click here to see all the free trading reports (tips) published by us on SBIN.
  • Equity trading picks.

BRIGADE ENTERPRISES Share Tips, Technical Analysis Chart, Intraday Stock Trading Graph Advice - Stock moving in a range bound zone , sharp move expecting once stock comes out from its range and closes above 145. (Updated on 03rd September 2014, Wednesday).


BRIGADE ENTERPRISES


DISHMAN PHARMA Share Tips, Technical Analysis Chart, Intraday Stock Trading Graph Advice - stock moving in a up channel formation, but current facing strong resistance around 162, further strength expecting once Dishman Pharma closes above 162. (Updated On 03rd September 2014, Wednesday).


DISHMAN PHARMA


  • Dishman Pharma current chart indicates that stock is moving in a up channel formation, so as long it moves in a channel pattern it will be favored by bulls. Breaking it up pattern on down side will indicates weakness.
  • As per candle studies showed in chart no2, stock has given bearish candle as witnessed selling from highs, this indicates that Dishman will favor bulls once it closes above its recent high @ 162, till then bulls may not find clear direction.
  • As per graph no3, Stock is trading above its 20 days moving average this will favor bulls but facing resistance at upper bollinger band around 162, once closes above it upper bollinger band indicates further strength for dishman.
  • If sock moves up from current levels and closes above 162 then bulls can have strong grip in this stock and looks bulls for  next few trading days. After that stock will find next strong resistance around 180 its 161.8% fibonacci retracement as shown in graph no4. Close Watch.
    • Intraday stock trading pick - close watch when Dishman starts trading above 162 during trading hours, if holds above 162 then intraday bulls action is expecting.
  • Click here to see all the free trading reports (tips) published by us on DISHMAN PHARMA.
  • Free intraday trading tips on Indian stock market.

ARIES AGRO Share Tips, Technical Analysis Chart, Intraday Stock Trading Graph Advice - Stock moving in a up channel pattern, and also moving up from support, further strength expecting once Aries Agro closes above 100. (Updated on 03rd September 2014, Wednesday).


ARIES AGRO LIMITED


  • As per previous report published on Aries Agro, stock closes above its top and bullish move was expected, as mentioned stock touched its resistance around 96. (Click here to see previous report published on ARIES AGRO).
  • Now current technical chart no1 indicates that stock is moving in up channel formation, so as long as it moves in its pattern it will be favored by bulls, but once it breaks its up formation on down side then sharp weakness is expecting. On upper side stock will find trend line resistance around 100, once it closes and stays above 100 then further strength is expecting and stock will be on bulls grip for next few trading days. Chart also indicates that volumes are also favoring Aries Agro, with continues up trend volumes are also picking up, this will favor bulls.
  • As per graph no2, 100 days moving average is playing a important role , by looking closely it indicates that from last 4 times stock touched 100 DMA and bounced back, and this time too same happened, this will favor bulls. So as long as stock holds above bull will be dominated in this stock.
  • As per stock analysis (chart no3), if Aries Agro moves from current levels and closes above 100 then bulls may get active and price improvement can be seen . So on upper side will find next strong resistance around 114 its 161.8%  fibonacci retracement.
  • As per chart no4, currently stock is also moving up from 50%  fibonacci retracement and stock major indicator like "MACD" and "stochastic oscillator" is moving on positive direction , so as long as they are moving in +ve direction we may see some price rise in coming days.
  • Click here to see all the free trading reports (tips) published by us on ARIES AGRO.
  • Free stock market trading tips India.

CANARA BANK Share Tips, Technical Analysis Chart, Intraday Stock Trading Graph Advice - Stock trading above 100 days moving average, will favor bulls, further strength expecting once CANARA BANK closes above 401.50. (Updated on 03rd September 2014, Wednesday).


CANARA BANK


  • As per previous report published on CANARA BANK , stock  has shown sharp up move after breaking its resistance @ 310 and stock touched its expected level @ 328 on a very same trading day. (Click here to see previous report published on CANARA BANK).
  • Now current technical chart indicates that Canara Bank is moving up from golden ratio support zone 61.8% fibonacci retracement as shown in chart no1. So as long as stock holds above it will be favored by bulls, once it closes below its golden ratio then sharp weakness is expecting.
  • As per chart no2 stock analysis ... Canara Bank is moving in a down channel formation this indicates as long as stock is moving in down formation it will be favored by bears, but stock is now trying to break it on upper side, close watch if stock closes and stays above 401.50 then stock will be favored by bulls and further price rise is expecting.
  • As per graph no3, stock is holding above 100 days moving average, this shows that as long as holds above it will favor bulls, we can see some action in this stock once it closes above 401.50.
  • As per chart no4, if stock moved up from current levels then will find strong fibonacci retracement around 401.50 , 413 and 425. Intraday bulls action is expecting once it breaks its resistance mentioned above.
  • Click here to see all the free trading reports (tips) published by us on CANARA BANK.
  • Intraday equity tips.

BHEL Share Tips, Technical Analysis Chart, Intraday Stock Trading Graph Advice - Stock has formed Triangle formation and is on the verge of bullish breakout if closes above 245. (Updated on 03rd September 2014, Wednesday).


BHEL


  • As per previous report published on BHEL stock had shown weakness after breaking its support @ 220, and after that made a low around 205, but after that bears lost their grip and stock again bounced back. (Click here to see previous report published on BHEL).
  • Now daily chart indicates stock had form Triangle formation this indicates BHEL to show sharp move if comes out from its formation, by looking at technical chart no1, BHEL tried earlier to break its formation on down side but failed to show major weakness and bounced back. And is now trying to breakout its formation on up side, If BHEL Closes and hold above its formation then sharp move can be seen in coming days.
  • As per chart no2, BHEL is also moving in down channel formation, and stock is now trying to come out from its down pattern, If closes and sustains above 245 then bulls may have stronger hand.
    • Intraday trading tips - close watch if bhel starts trading above 245 during market hours if holds above then intraday bulls action is expecting.
  • As per graph no3, stock is also facing golden ratio resistance 61.8% fibonacci retracement  @ 245, if stock closes and stays above 245 then stock looking bullish for next few trading days. and will find next resistance around 265 its recent top.
  • As per graph no4, stock is now trading above 50 days moving average , as long as stock holds above it will favor bulls , but once closes below 50 DMA then stock will show first sign of weakness. Close Watch.
  • Click here to see all the free trading reports (tips) published by us on BHEL.
  • Free share market tips India.

Advertisement

What is Intraday Tips ?

Q. What is Intraday Tips / Inraday Trading / Delivery trading.

A. There are basically two types of trading on stock market--
1- Delivery
2- Intraday

Delivery trading is one in which shares are bought and can only be sold after they are delivered by the broker.that means that they cannot be sold the same day , and delivery takes two to three days after they are bought and then they are ready to be sold.

Intraday trading which takes place for that very particular day and there is no delivery..they can be bought and sold the same day...and are automatically sold at the end of the trading session if you have not sold it by yourself during the trading session. The person who suggest such types of forecast is called

Intraday Tips

.