Advertisement

ICICI BANK has formed head and shoulder formation in daily chart, sharp movement expecting once it comes out.


ICICI BANK


  • Stock has formed head and shoulder formation in daily chart, sharp movement expecting once stock has comes out.
  • Stock is also moving up from 100 DMA, as long as ICICI Bank holds above bulls will be favored.
  • On upper side stock will find strong trend line resistance around 367.
  • On down side stock will find neckline support around 335, if stock closes and holds below 335 then weakness can be seen in ICICI.

MARUTI SUZUKI technical chart- stock is finding strong trend line resistance around 3515.


MARUTI SUZUKI


  • Stock is currently moving up from strong trend line and 50 DMA, chart indicates as long as stock holds above bulls will favored.
  • On upper side stock will find strong trend line resistance around 3515, once it closes and holds above 3515 then further strength can be seen. Close Watch.

CIPLA stock tips - Stock has formed triangle formation in daily chart, sharp movement expecting once stock comes out.


CIPLA LTD


  • Stock has formed triangle formation in daily chart, this indicates sharp movement can be seen once stock comes out from its pattern.
  • Cipla also moving up from 100 DMA, as long as stock holds above bulls will be favored.
  • On upper side stock will find strong trend line resistance around 645, once cipla closes and holds above 645 then further strength can be seen.
  • Stock major trend indicator "MACD" is moving in +ve zone this will favor bulls as long as stock moving in positive.

BHEL facing strong support at current levels, weakness can be seen once closes and holds below 250.


BHEL


  • Stock finding strong golden ratio support around 250, chart indicates weakness can be seen once stock closes and holds below.
  • Stock also finding 100 DMA support at current levels, as long as holds above bulls will be favored, once closes and holds below then further weakness can be seen. Close Watch.

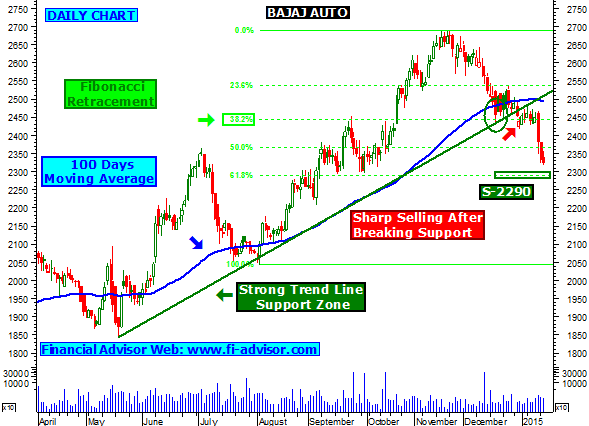
BAJAJ AUTO trading ideas - stock showing weakness after breaking support, will now finding support around 2290.


BAJAJ AUTO


  • Stock has shown sharp weakness after breaking in strong trend line and 100 DMA support zone.
  • Bajaj Auto technical indicates that stock will now find strongfibonacci retracement support zone @ 2290, can see come bounce if takes this support. And further weakness expecting once it closes and holds below 2290. Close Watch.

TATA MOTORS free share tips - Stock moving up from strong support, is now on verge of breakout above 526.


TATA MOTORS


  • Stock moving up from 200 DMA, short-long term bulls will be favored as long as stock holds above.
  • Stock major trend indicator "Stochastic Oscillator" is moving in +ve zone this indicates further price rise can be seen in coming days.
  • On upper side Tata Motors is finding fibonacci retracement resistance around 526, chart indicates once it closes and holds above 526 then further price rise can be seen. Close Watch.

HERO MOTOCORP technical outlook- Stock showing weakness after breaking its support.


HERO MOTOCORP


  • Stock showing strong weakness after breaking its strong trend line and 50 days moving average support zone.
  • Stock major trend indicator is now trading in -ve zone this indicates further weakness can be seen in coming days.
  • Hero motocorp will now find strong trend line support around 2875 and 2740, can see some action if stock take this support. Close Watch.

RELIANCE INFRA equity tips - Stock moving in range bound zone, sharp movement expecting once it comes out from its pattern.


RELIANCE INFRA


  • Stock currently witnessing selling pressure from its 20 DMA, as long as trades below bears will be favored.
  • Reliance Infra is currently stuck in a range bound zone, sharp movement expecting once it comes out from its pattern.
  • On upper side will find resistance around 525 and down side will find support around 473.50.

RELIANCE CAPITAL trading tips - stock has formed head and shoulder formation, weakness expecting if breaks it support @ 460.


RELIANCE CAPITAL


  • Stock has formed head and shoulder formation in daily chart, this indicates sharp movement expecting once stock comes out from its pattern.
  • Stock major trend indicator is moving in -ve zone, this indicates further weakness can be seen.
  • On down side stock will find strong trend line support around 460, once it closes and holds below 460 then further weakness can be seen.

Advertisement

What is Intraday Tips ?

Q. What is Intraday Tips / Inraday Trading / Delivery trading.

A. There are basically two types of trading on stock market--
1- Delivery
2- Intraday

Delivery trading is one in which shares are bought and can only be sold after they are delivered by the broker.that means that they cannot be sold the same day , and delivery takes two to three days after they are bought and then they are ready to be sold.

Intraday trading which takes place for that very particular day and there is no delivery..they can be bought and sold the same day...and are automatically sold at the end of the trading session if you have not sold it by yourself during the trading session. The person who suggest such types of forecast is called

Intraday Tips

.