Showing posts with label bank of india. Show all posts
Showing posts with label bank of india. Show all posts


Bank Of India free Indian share market tips and equity tips updated for 25th November 2015, Wednesday.
BANK OF INDIA

Bank Of India closed below its previous bottom, technical indicates bears will be favored as long it holds below.
Stock major trend indicator is moving in negative zone this indicates further weakness can be seen in coming days.
Click to read article on how stock market works.
Intraday Bank of India looks weak if it holds below 124.
Will find support around 121.50, 120.
S.L - 126.
Will find support around 121.50, 120.
S.L - 126.
Bank of India stock market forecast and stock tips updated for 24th November 2015, Tuesday.
BANK OF INDIA

Bank of India has formed triangle pattern in daily chart technical indicates sharp movement can be seen once stock comes out from its pattern as shown in above technical charts.
Down side stock will find strong support around 126, weakness can be seen once stock closes and holds below 126.
Click link below to see US stock market forecast.
Will find support around 123, 121.
S.L - 128.
Bank Of India free Indian share market tips updated for 03rd September 2015, Thursday.

BANK OF INDIA

Bank of Indian finding strong trend line support at current levels, technical indicates stock can see some weakness once it closes and holds below its trend line support zone @ 130.
Intraday free Indian share market tips updated for 03rd September 2015, Thursday.
Bank Of India looks weak below 130.
Will find support around 127, 125.
S.L 132.
Bank of India stock market tips and nse tips updated on 18th August 2015, Tuesday.
BANK OF INDIA

Bank of Indian finding strong trend line resistance at its previous top @ 188, as per technical analysis stock can see some price action once it closes and holds above its resistance zone @ 188.
Free intraday stock market tips updated for 18th August 2015, Tuesday.
Bank of India looks good above 188.
Will find resistance around 191, 193.
S.L 186.
Visit link to see Guide to investing in penny stocks.
Bank of India stock tips updated on 25th July 2015, Saturday.

Bank of India witnessing selling pressure from its strong trend line resistance and now its finding strong trend line support at current levels @ 168. Chart indicates further weakness can be seen once it closes and holds below 168.
Free intraday stock tips updated for 27th July 2015, Monday.
Intraday bank of India looks weak below 168.
Will find support around 165, 163.
S.L 170.
Click to read article on Golden trading rules.
Bank of India free stock market tips updated on 07th June 2015, Sunday.

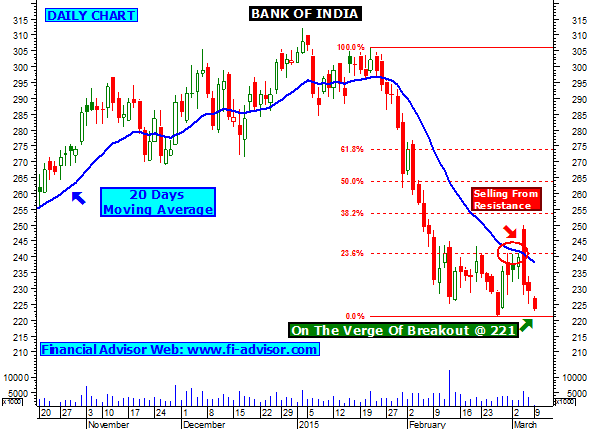
Bank of India free stock market tips indicates that it is witnessing selling pressure from 50 DMA this will favor bears and has now closed below its major support zone i.e its previous bottom. Technical indicates its previous support will now act as a major resistance for bank of India.
Its major trend indicator MACD is now trading below level zero and that too in negative zone as shown in above technical graph.
Bank Of India stock market tips India chart updated on 12th May 2015, Tuesday.

Stock witnessing selling pressure from 50 days moving average and it is currently trading below 20 days moving average in bollinger band as shown in above images this indicates bears will be favored.
On down side stock will find strong trend line support at its previous bottom, once Bank of India closes and holds below its support zone then further weakness can be seen in coming days. Visit our site for more Indian stock market tips.
Stock major trend indicator is moving in negative zone this indicates further weakness can be seen in coming days.
BANK OF INDIA moving up after forming doji candle formation - Technical chart for 29th April 2015, Wednesday

Stock moving up from golden ratio support zone and also after forming doji candle pattern as shown above in technical chart, as long as stock holds above its golden ratio bulls will be favored and further price rise can be seen in coming days, but once it holds below its recent lows then stock can test its previous bottom which is around 192 levels.

Bank Of India Share market tips
BANK OF INDIA


- Stock moving up from neckline support @ 271.50, this indicates as long as stock holds above bulls will be favored.
- Stock also moving up from 38.2% fibonacci retracement support zone @ 271.50 this will favor bulls as shown in technical chart no2.
- Stock also moving up from 100 DMA, this indicates bulls active in Bank Of India.
BANK OF INDIA Share market tips, Share trading

BANK OF INDIA


- Stock has formed head and shoulder formation in daily chart, sharp movement expecting once stock comes out from its formation.
- On upper side will find strong trend line resistance around 297, 303 and 310, closing above its resistance zone can give further price rise.
- Technical chart no3 also indicates that stock is trading above 20 DMA this will favor bulls for further price rise.
BANK OF INDIA Share Tips, Technical Analysis Chart, Intraday Stock Trading Graph Advice - Stock has formed head and shoulder formation , will favor bulls once closes above 297. (Updated on 08th September 2014, Monday).

BANK OF INDIA


- As per previous report published on Bank Of India, stock has shown weakness from its resistance and failed to breaks 303 on upper side, made a low around 262. (Click here to see previous report published on BOI).
- Now current chart indicates that stock has formed head and shoulder pattern , this indicates that once stock breaks it formation on upper side then BOI will be in bulls grip for next few trading days, as shown in graph no1.
- Suggested Article - NSE HOLIDAYS 2014.
- As per stock analysis chart no2, stock is also moving in down channel pattern and now trading above its pattern , this will favor bulls to take stock further up, On upper side stock will find strong trend line resistance around 297, 303 and 310. Once closes above it resistance level mentioned above then stock will be strong grip for next few trading days.
- Suggested Reading - TITAN facing strong resistance at current levels, stock can see some correction.
- Intraday trading tips - close watch once stock starts trading above 297, if holds above 297 then intraday bulls action is expecting.
- As per chart no3, stock is now trading above 20 days moving average, so as long as holds above 20 DMA bulls will be favored but once closes below 20 DMA then stock will shown first minor bears signal. Close Watch.
- BOI chart no 4 also indicates that it is holding its strong trend line support, from last 2 times stock broke its support and bounce back again and made a false breakout. As long as stock holds its trend line support chances are high stock can move up.
- Click here to see all the free trading reports (tips) published by us on BANK OF INDIA.
- Free Share Market Tips.
BANK OF INDIA Share Tips - Stock witnessed selling from resistance, Stock will favor bears as long as trades below 303 - as per technical analysis point of view. Updated for 28th July 2013, Monday).


- BANK OF INDIA moving in a down channel and witnessed selling from resistance as shown above, Close watch as long as trades below 303 stock will favor bears.
- Closing above 303 will favor bulls.
- Daily chart also indicates stock has formed Bearish Engulfing candle formation and also closed below 20 days moving average this will too favor bears.
- Click here to understand Candlestick studies. - An article published by us.
- If stock falls from current levels then will find strong trend line support around 267, 264, 256. Close Watch.
- Click here to see all reports published by us on BANK OF INDIA on the bases of Technical Analysis.
BANK OF INDIA on the verge of breakout above 248.50. - 12th May 2014.


- BANK OF INDIA has for bullish head and shoulder formation.
- Stock also trading above 20 days moving average, looks bullish
- Close Watch stock will be facing its trend line resistance around 248.50. Once starts trading above 248.50 with volumes then can move further.
Visit our blog daily for free share market tips on Indian stock market.
Free Intraday Tips - BANK OF INDIA


BANK OF INDIA moving in a up channel as shown above , close watch chart indicates once bank of india starts trading above 238 then can see some intraday actions.
About Bank Of India - Bank of India was founded on 7th September, 1906 by a group of eminent businessmen from Mumbai. The Bank was under private ownership and control till July 1969 when it was nationalized along with 13 other banks.
Subscribe to:
Posts (Atom)