Advertisement

OBC Share Tips, Technical Analysis Chart, Intraday Stock Trading Graph Advice - Stock currently stuck between 288 and 253 levels, Close watch sharp move expecting on any side OBC breaks. (Updated on 10th September 2014, Wednesday).


ORIENTAL BANK OF COMMERCE


APOLLO TYRES Share Tips, Technical Analysis Chart, Intraday Stock Trading Graph Advice - Stock facing strong trend line resistance at current levels, RSI has also entered in overbought zone, Close Watch for 218 level strong resistance for Apollo Tyres. (Updated on 10th September 2014, Wednesday).


APOLLO TYRES


ADANI PORT Share Tips, Technical Analysis Chart, Intraday Stock Trading Graph Advice - Stock facing strong trend line resistance at current levels, Close watch stock to favor bulls once ADANI PORT closes and stays above 302. (Updated on 10th September 2014, Wednesday).


ADANI PORT


  • As per current technical charts no1, ADANI PORT is moving in a up channel formation, as long as stock is moving in channel pattern bulls will be favored, once breaks it pattern on down side then weakness expecting.
  • Chart no2, indicates that 50 days moving average playing an important role in Adani Port, from last 6 time stock took 50 DMA support and bounced back , as long as stock holds above bulls will be favored, once stock closes below 50 DMA then stock will show first sign of weakness.
  • As per graph no3, stock is holding its strong trend line support, as long as holds above trend line short term traders will be favored, and on upper side Adani Port finding resistance around 302, Once stock closes above 302 and holds above then further strength is expecting for next few trading days.
    • Intraday trading tips - Close watch once Adani Port starts trading above 302 during Indian stock market hours, if holds above 302 then intraday bulls action is expecting.
  • As per graph no4, if Adani Port moves up from current levels and closed above 302 then stock will find next strong resistance around 317 its 161.8% fibonacci retracement, close watch.
  • Click here to see all the free trading reports (tips) published by us on ADANI PORT.
  • Free Stock Market Tips.

ICICI BANK To Split Its Share For The First Time In History, One Share In To Five Shares.


ICICI BANK SHARE SPLIT 1:5

India`s largest private bank- ICICI Bank on 09th Sep 14. has decided to split its shares, for the first time in history, from one share into five shares.

Accordingly, additional proportionate american depository shares (ADS) would be issued to maintain the ratio of one ADS to two equity shares, said by the bank. The board of directors of the ICICI bank has approved the sub-division of one equity share of the ICICI bank having a face value of Rs 10 into five equity shares of face value of Rs 2 each. Each American Depositary Share (ADS) of ICICI Bank will continue to represent two underlying equity shares as at present.

The number of ADSs held by an American Depositary Receipt holder would consequently increase in proportion to the increase in number of equity shares. The ICICI BANK further said the sub-division of shares will be subject to approval by the shareholders, which will be sought by postal ballot, and any other applicable statutory and regulatory approvals.

Accordingly the company will announce the record date for sub-division of shares in due course. Shares of  ICICI Bank gained as much as 1.3 percent in early trade on Wednesday.


Please note- Report may contains some error, Plz visit any financial website or ICICI BANK for confirmation.

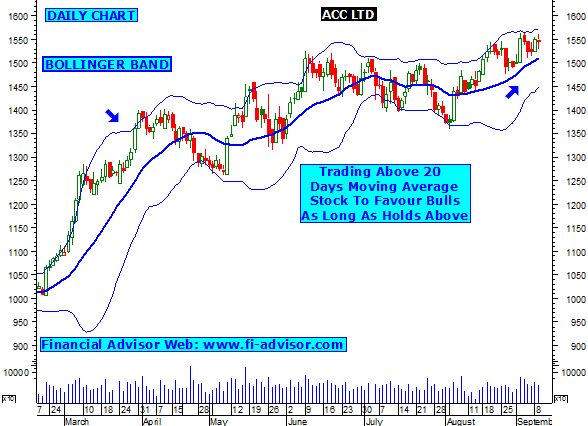
ACC LTD Share Tips, Technical Analysis Chart, Intraday Stock Trading Graph Advice - Stock facing strong trend line resistance at current levels, further strength expecting once ACC closes above 1565. (Updated on 10th August 2014, Wednesday).


ACC LTD


  • As per previous report published on ACC LTD, stock gave a false breakout after breaking its resistance @ 1545, stock closed above 1545 and after that made a high around 1565 and again came down. (Click here to see previous report published on ACC LTD).
  • Now as per current stock analysis chart no1, stock is facing strong trend line resistance around 1565, this indicates as long as stock trades below bears can get active, but once ACC closes above 1565 and holds above then bull will have strong hands once again in ACC and stock can move up further for few trading days.
    • Intraday trading tips - Close watch once stock starts trading above 1565, if holds above 1565 during Indian stock market hours then intraday bulls action is expecting.
  • As per graph no2, ACC is holding above 20 days moving average , as long as stock holds above 20 DMA bulls will ve favored ,but once ACC close below 20 DMA stock will show first sign of weakness.
  • As per chart no3, stock major trend indicator "MACD" is moving in +ve zone and also above level zero, as long a MACD positive this will show ACC can see some higher price. If ACC moves up from current levels then stock will find next strong resistance around 1625 its 161.8% fibonacci retracement, close watch.
  • Click here to see all the free trading reports (tips) published by us on ACC LTD.
  • Free share market trading tips.

M&M FINANCIAL SERVICES Share Tips, Technical Analysis Chart, Intraday Stock Trading Graph Advice - Stock facing strong golden ratio resistance at current levels , will favor bulls once closes above 290. (Updated on 10th September 2014, Wednesday).


M&M FINANCIAL SERVICES


WIPRO LTD Share Tips, Technical Analysis Chart, Intraday Stock Trading Graph Advice - Stock has formed head and shoulder formation in daily chart, Wipro to favor bulls once it closes above 595. (Updated on 10th September 2014, Wednesday)


WIPRO LTD


COX AND KINGS Share Tips, Technical Analysis Chart, Intraday Stock Trading Graph Advice - Stock facing strong support and current levels this will favor bulls, further strength expecting once COX & KINGS closes above its recent high @ 310. (Updated on 09th September 2014, Tuesday).


COX AND KINGS


  • As per previous report published on COX & KINGS , stock showed sharp up move after breaking its resistance @ 278.50 and after that made a high around 308 in just 3 trading days. (Click here to see previous report published on COX & KINGS).
  • Now current chart no1 indicates that stock is moving in a up channe formation so as long stock in up patter it will be favored by bulls, once Cox & Kings comes out from up pattern and breaks it on down side then stock can give some correction. Close Watch.
  • As per graph no2, stock is facing 23.6% fibonacci retracement support at current and is holding above, so as long as stock holds above 288 chances are high that stock may move up, but once stock closes and stays below 288  then will find next support around 280 its 38.2% fibonacci retracement.
  • As pe chart no3, stock is also holding above 161.8% fibonacci retracement , its previous resistance is now acting as a major support for Cox & Kings, close watch once stock closes and stays above its recent high @ 310 then further strength is expecting and stock can be in bulls grip for next few trading days.
  • Click here to see all the free trading reports (tips) published by us on COX & KINGS.
  • Tips On Share Market.

Advertisement

What is Intraday Tips ?

Q. What is Intraday Tips / Inraday Trading / Delivery trading.

A. There are basically two types of trading on stock market--
1- Delivery
2- Intraday

Delivery trading is one in which shares are bought and can only be sold after they are delivered by the broker.that means that they cannot be sold the same day , and delivery takes two to three days after they are bought and then they are ready to be sold.

Intraday trading which takes place for that very particular day and there is no delivery..they can be bought and sold the same day...and are automatically sold at the end of the trading session if you have not sold it by yourself during the trading session. The person who suggest such types of forecast is called

Intraday Tips

.