Advertisement

BANK OF BARODA Share Tips - Stock on the verge of breakout its range bound zone. (Updated On 01st July 2014, Tuesday).


  • BANK OF BARODA is moving in a range bound zone in hourly chart, which indicates stock to give sharp move when it comes out from its range bound zone. Currently moving in a range of 897 - 813.
  • Daily chart indicates that stock is moving up from its 38.2% fibonacci retracement support zone, which will favor bulls when stock breaks it range bound formation.
  • Daily chart also indicates that stock is currently trading above its trend line resistance and also 20 days moving average both indicates bullish signals as long as it holds above. Close Watch.


ASIAN PAINTS Stock Tips - Will be finding strong resistance around 605 & 620. (Updated On 01st July 2014, Tuesday).


  • ASIAN PAINTS gave a good move after breaking its double bottom formation as mention in our previous report (Click to see report on - Asian Paint).
  • Stock is now on run daily chart indicates that so far stock will favor bulls and will find strong resistance 161.8% fibonacci retracement around 605.
  • Weekly chart indicates Asian Paints will find strong fibonacci retracement and trend line resistance around 620. As shown above.
  • Monthly chart indicates stock is moving in a long up channel and will still favor bull. But again will find resistance around 620. Close Watch.
  • Past report you may find interesting to read - Gitanjali Gems.


BPCL Share Tips - Stock has formed Triangle Formation in hourly chart. (Updated On 30th June 2014, Monday).


  • BPCL has formed triangle formation in hourly charts, which indicates, stock to give sharp intraday move once it come out from its triangle formation on either side. Close Watch.
  • Daily chart indicates that stock moved from its  fibonacci fan 1st line support as shown above as long as it trades above stock to favor bulls.
  • Weekly chart indicates stock is moving up from 23.6% fibonacci retracement and 10 weeks moving average, will favor bulls.
  • So far chart indicates stock to break its triangle formation on upper side. Close Watch.
  • Suggested stock to read from past report - Indraprastha Gas Ltd (IGL)


TECH MAHINDRA Share tips - Stock on the verge of bullish breakout in monthly chart. (Updated On 30th June 2014, Monday).


  • Tech Mahindra gave a good up move after bullish breakout @ 2050 , report published on 26th June 14, Click to see past report on Tech Mahindra
  • Now Daily chart indicates stock made a bullish breakout with long bull candle with indicates stock still favor bulls.
  • Weekly chart indicates stock gave a sharp up move and still moving up after breaking its range bound zone.
  • Monthly chart of Tech Mahindra indicates that stock is on the verge of bullish breakout and as trading above its major resistance once closes above its strong trend line resistance in monthly chart and must stays above then tech Mahindra will favor long term bulls.
  • Suggest past report on the bases of technical analysis TATA ELXSI


Tips On Share - FEDERAL BANK showing bullish indication in Daily ,Weekly & Monthly Chart. (Updated On 30th June 2014, Monday).


  • FEDERAL BANK is moving in a range bound zone in daily chart and now trying to break its range, chart also indicates that stock is moving up from 20 days moving average, Once stock breaks its range (135 - 114.50) and stays above then bulls to get active in Federal Bank and can take the price further up.
  • Weekly chart indicates that stock was moving in long up channel and now trying to come out from its formation, close watch as long as Federal Bank stays above its formation will favor bulls.
  • For free tips on share on Indian stock market visit our blog daily.
  • Monthly chart indicates that stock closed above its major resistance and will favor long term bulls. On upper side stock will face 161.8% fibonacci retracement around 153.
  • Suggested previous post - Technical view point on Reliance Communications.
  • Click here to see all the free trading reports (tips) published by us on FEDERAL BANK.

Tips On Stock - BRITANNIA INDS - Stock on the verge of breakout above 1008. (Updated On 30th June 2014, Monday).


  • BRITANNIA INDS moving up from trend line support in daily chart as shown above, chart indicates that stock is now facing strong trend line resistance around 1008, if starts trading above and closes above its trend line resistance then Britannia is looking good and will favor bulls.
  • (Short term trend) - Weekly chart of Britannia  indicates that stock is now trading above its major resistance if closes above its resistance zone in weekly chart then will take stock further up and it must stays above it resistance.
  • (Long term trend) - Monthly chart of Britannia indicates that stock is moving in a long term bullish zone and still will favor bulls, stock will now face strong trend line resistance around 1100 as shown above.
  • Other report you might find interesting - ALSTOM T&D (I)


Technical Analysis Of CESC LTD - Further buying expecting above 657. (Updated On 30th June 2014, Monday).


  • CESC LTD gave a sharp move in intraday once it broke its range bound zone as shown above. Stock will now face resistance around 657 in hourly chart, Once CESC breaks 657 with volumes and must stays above then can see some intraday action in CESC.
  • Daily chart indicates stock is moving up from 38.2%  fibonacci retracement support zone and gave a sharp up move after that, Chart indiciates if stock closes above 657 with volumes and sustains above then can see bulls to get active for next 1-2 days.
  • (Short term trend) - Weekly chart indicates that stock gave sharp move after breakout in past, this time will find resistance around 657, if closes above 657 in weekly charts then stock will favor short term traders.
  • (Long term trend) - Monthly chart indicates that stock is trading above 161.8%  fibonacci retracement and long term trend is still bullish. Stock will now find resistance around 720 (trend line).
  • Previous report you find interesting to read - Bank nifty trading tips.


TATA ELXSI Share Tips - Stock to extend its gains after major Triangle Formation breakout. (Updated On 30th June 2014, Monday).


  • As per previous report given on 26th June 2014 (Visit link - Tips On Share TATA ELXSI) stock gave a sharp move after breaking its triangle formation, Technically stock will favor bulls and on upper side will face trend line resistance around 670.
  • (Short term trend) - Weekly chart indicates that stock is moving up from 38.2 % fibonacci retracement and 20 weeks moving average, as long as holds above stock will favor bulls for short term trades
  • (Long term trend) - Monthly chart indicates that stock is coming down from 261.8% fibonacci retracement and now correcting. Once Tatat elxsi closes above 261.8% fibonacci retracement then stock will favor long term bulls till then no clear direction for long term traders of TATA ELXSI.
  • Previous report you might find it intresting reading - Tips On Share Alstom T&D (I).

SESA STERLITE - Technical Analysis - Showing weakness in daily chart - Updated On 30th June 2014, Monday.


  • SESA STERLITE stuck in a strong range in a daily chart, indicates once stock comes out from its range then we can expecting some intraday sharp move. 
  • Daily chart indicates stock has broken its  fibonacci fan line support as shown above which indicates further weakness , stock will now face 23.6% fibonacci retracement support around 283, If stock breaks with volumes and closes below and must stays below 283 then we can can expect further selling in sesa sterlite for next 1-2 days.
  • (Short term trend) - Weekly chart indicates stock is look bullish as no sign of coming down from resistance, after making a bullish breakout in past , its previous resistance will now act as a major support, for short term traders if sesa sterlite falls then will find support around 270 levels.
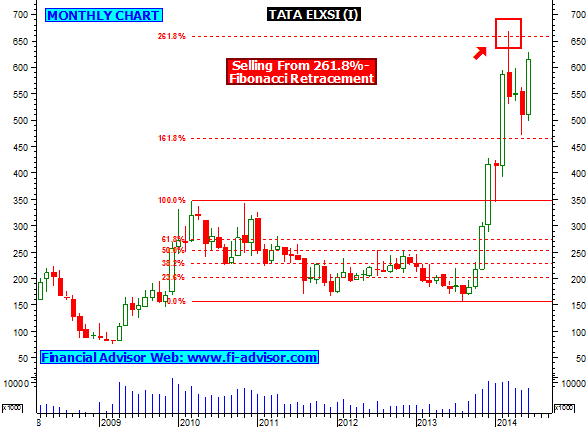
  • (Long term trend) - Monthly chart indicates that stock is coming down from its 50%  fibonacci retracement resistance , as bulls lost their int erst in stock and price came down (as shown above). Stock must close above its 50%  fibonacci retracement for long term trend to turn bullish again.
  • Suggested stock to see - Stock Analysis on United Phosphorus (UPL)
Next Stock Will Now Update On 28th June 2014, Saturday Around 7:30 pm


CIPLA LTD Technical Analysis - Stock moving up from strong support. (Updated For 30th June 2014 , Monday).


  • CIPLA LTD moving up from strong fibonacci fan support in daily charts as shown above, stock will now find resistance around 443, once stock breaks with volumes and starts trading above 443 and must stays above then will see some bulls action for 1-2 days.
  • (Short term trend) - Weekly chart indicates stock is stuck in a range bound zone and short term trend is not clear till it breaks it range bound zone.
  • (Long term trend) - Monthly chart indicates that stock is in long term bullish mode and is moving up from strong 23.6%  fibonacci retracement and also from strong trend line support zone as shown above. On upper side will find resistance around 450, Once Cipla closes above 450 in monthly chart then stock to extend its bull rally.
  • Stock analysis you find interested in reading - Trading tips on Bank Nifty


UNITED PHOSPHORUS (UPL) stock analysis - Will find resistance around 330 in daily chart. (Updated On 27th June 2014, Friday).


  • UNITED PHOSPHORUS (UPL) is moving up from 23.6% fibonacci retracement and now trading in a small up channel formation as shown above, daily chart indicates that stock may see some action once closes above 330 with volume, for further up move it must stays above 330.
  • (Short term trend) - Weekly chart of UPL indicates that stock will favor bulls and will find its next resistance around 423.6% fibonacci retracement as shown above.
  • (Long term trend) - Monthly chart indicates that stock is continuously moving up after it made a bullish breakout as shown above , so far stock is not showing any sign of fall, and will find its long term resistance around 261.8% fibonacci retracement. Close Watch.
  • Suggested stock with technical outlook - Share Tips On ICICI BANK


Next Stock Will Update on 27th June 2014, Friday Around 1:30 pm.


HCL TECHNOLOGIES Stock Analysis - Stock on the verge of breakout facing strong trend line resistance. (Updated On 27th June 2014, Friday).


  • HCL TECHNLOGIES facing strong trend line resistance in hourly chart around 1475 , Hourly chart indiciates once stock starts trading above 1475 with volumes and must stays above then intraday we can see some bullish action.
  • Daily Chart indicates that stock facing same trendline resistance around 1475, if stock closes above 1475 and must stays above then bulls to extend rally for next 2-4 days.
  • Daily chart also indicates stock trading above 100 days moving averge which will favor bulls to take stock further up.
  • (Long term trend) - Monthly chart indiciates stock moving up from 23.6%  fibonacci retracement as long as hold above stock can move up and will fave 0%  fibonacci retracement resistance around 1600. Close Watch.
  • Click here to read stock analysis Of Cadila health care.
Next stock will update on 27th June 2014, Friday Around 12:00 pm.


Advertisement

What is Intraday Tips ?

Q. What is Intraday Tips / Inraday Trading / Delivery trading.

A. There are basically two types of trading on stock market--
1- Delivery
2- Intraday

Delivery trading is one in which shares are bought and can only be sold after they are delivered by the broker.that means that they cannot be sold the same day , and delivery takes two to three days after they are bought and then they are ready to be sold.

Intraday trading which takes place for that very particular day and there is no delivery..they can be bought and sold the same day...and are automatically sold at the end of the trading session if you have not sold it by yourself during the trading session. The person who suggest such types of forecast is called

Intraday Tips

.