DEVON ENERGY CORPORATION
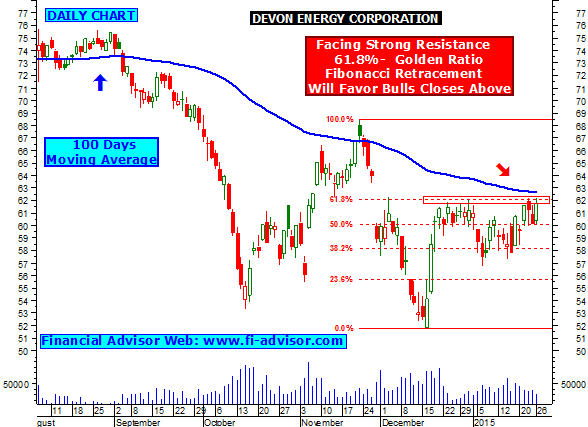
- Stock currently finding strong fibonacci retracement golden ratio resistance around 62.18, technical chart indicates further price rise can be seen once stock closes and holds above 62.18.
- Stock also finding 100 days moving average resistance as long as holds below bears will be favored, but once it starts trading above 100 DMA then bulls will be favored.
- Us stock market tips.


