ULTRATECH CEMENTS


- Ultratech Cements is currently facing strong golden ratio resistance at current levels, chart indicates once stock closes above its golden ratio resistance @ 2750 then stock will be in bulls grip for next few trading days and will find next strong resistance around 2850 its previous top as shown in stock analysis chart no1.
- Intraday Trading Tips - Close watch once stock starts trading above 2750, if holds above 2750 during trading hours then intraday bulls action is expecting in Ultratech.
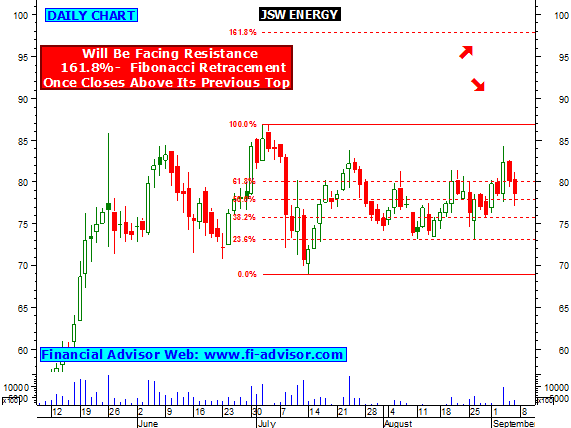
- Suggested Reading - JSW ENERGY moving in a range bound zone, sharp move expecting when it comes out.
- Technical Chart no2, indicates that stock is moving up from 100 days moving average, by looking closely stock indicates that from last 3 times bounced back form 100 DMA, so as long as holds above it will favor bulls, but once closes below 100 DMA it will show first sign of weakness.
- Suggested Article - Commodity Trading Tips.
- Chart no 3 indicates that stock is also holding its long trend line support , from last 4 times stock moved up from trend line support, as long it holds trend line stock will be favored by bulls.
- Click here to see all the free trading reports (tips) published by us on ULTRATECH CEMENTS.
- Free Day Trading Tips.