Advertisement

Tips On Share - Larsen And Toubro can see weakness below 23.6 % fibonacci retracement in daily chart (Updated On 26th June 2014, Thursday).


  •  Larsen And Toubro facing strong support around 1628 23.6 % fibonacci retracement, chart indicates once starts trading below 23.6 % fibonacci retracement then see further correction in Larsen And Toubro.
  • Weekly chart also coming down from 261.8% fibonacci retracement , indicates further correction as long as trades below 261.8% fibonacci retracement.
  • Monthly chart indicates long term trend is still bullish as stock closed above its major resistance, its previous resistance will now act as a major support for Larsen And Toubro.

Next Stock Will Update On 26th June 2014, Thursday , Around 3:00 am - TITAN COMPANY

Tips On Share Market - DR REDDYS LABS trading above 38.2% fibonacci retracement , will favor bulls. (Updated On 26th June 2014, Thursday).


  • DR REDDYS LAB moving up from strong 161.8% fibonacci retracement and still moving up after taking support around 2260. As shown above.
  • Daily Chart also indicates that stock is now trading above its 38.2% fibonacci retracement and will favor bulls to take price further up. On upper side stock will face fibonacci retracement resistance around 2515, 2575.
  • Monthly chart of Dr Reddys labs indicates that stock is moving up from its 23.6% fibonacci retracement and favor long term bulls, if stock moves up from current levels and stays above then can test its previous top around 2950 in coming months.
Next Stock Update On 25th June 2014, Wednesday Around 7:00 pm


Tips On Share - RELIANCE COMMUNICATIONS facing strong resistance between 155 - 165. (Updated On 25th June -2014, Wednesday).


  • RELIANCE COMMUNICATIONS is facing strong trend line resistance between 155 - 165 as shown above, chart indicates stock will not give clear signals till stock comes out from its trend line resistance levels.
  • Weekly Chart too indicates that stock facing strong trend line resistance around 155 and next resistance around 165. Even short term trend of Reliance Communications is not clear.
  • Monthy chart indicates that stock is trading above 50 months moving average , indicates that stock to favor bulls as long as stays above. Chart also indicates that stock came down from 38.2% fibonacci retracement earlier if now breaks and closes above 38.2% fibonacci retracement in monthly chart then looks good for long term trade. Close Watch.
  • Visit our blog daily for free intraday tips on stock market.
  • Stock was on newsRELIANCE COMMUNICATION is launching a share sale to institutional investors as it looks to reduce debt. The company said it would sell shares for Rs. 142.13 each, or a discount of 5 per cent to the floor price, but the company did not specify the number of shares being sold in the offering. (Source NDTV PROFIT).
Next Stock Updated on 25th June 2014, Wednesday Around 5:00 pm


Tips On Share Market India - BIOCON is on the verge of breakout, has formed double bottom formation. (Updated On 25th June 2014, Wednesday).


  • BIOCON is moving in a range bound zone from last few weeks, stock is moving in a rage zone of 510 -514 as shown above, stock is today trying to come out from its range. If BIOCON closes above 514 and stays above then further up move is expecting in BIOCON.
  • Weekly chart is indicating stock has formed double bottom bullish formation and is on the verge of breakout above same level @ 514, If stock closes above 514 in weekly chart and remains above then stock is looking bullish for its short term.
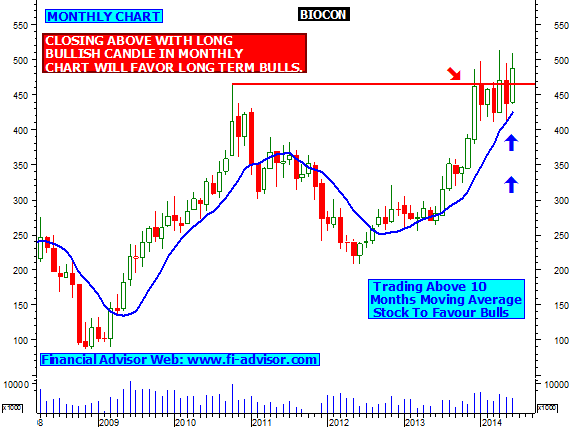
  • Monthly chart indicates that Stock will turn bullish for long term if it closes above trend line resistance with a long bull candle which is currently in progress for the month of June. Stock also moving up from 10 months moving average which will favor bulls to take stock further up in coming months.
Next Stock update at 25th June 2014, Wednesday, Around 2:00 pm


Share Market Tips - INDRAPRASTHA GAS (IGL) on the verge of breakout. (Updated On 25th June 2014, Wednesday).


  • INDRAPRASTHA GAS is moving in an up channel formation and will be facing minor trend line resistance around 357 in daily chart, Up channel formation indicates that stock to favor bulls as long as it moves in up channel formation.
  • Weekly chart of IGL indicates that stock moving up from 23.6% fibonacci retracement support, above 357 will favor short term bulls if closes above in weekly chart.
  • Monthly chart of IGL indicates that stock is trading on its golden ratio fibonacci retracement resistance level , if stock closes above 61.8% fibonacci retracement and stays above then long term trend of IGL remain bullish. Close Watch.
  • Stock was on news today - In oil and gas space we are hearing a lot of positive news but (IGL) has been a very slow mover so far, it has remain a laggard.
  • After diesel, the government is considering raising cooking gas (LPG) and kerosene rates in small doses of Rs. 5 per cylinder and Rs. 0.50-1 a litre every  month to wipe out Rs. 80,000 crore subsidy on the two fuels.
Next Stock Update on 25th June 2014, Wednesday, Around 1:00 pm


Advertisement

What is Intraday Tips ?

Q. What is Intraday Tips / Inraday Trading / Delivery trading.

A. There are basically two types of trading on stock market--
1- Delivery
2- Intraday

Delivery trading is one in which shares are bought and can only be sold after they are delivered by the broker.that means that they cannot be sold the same day , and delivery takes two to three days after they are bought and then they are ready to be sold.

Intraday trading which takes place for that very particular day and there is no delivery..they can be bought and sold the same day...and are automatically sold at the end of the trading session if you have not sold it by yourself during the trading session. The person who suggest such types of forecast is called

Intraday Tips

.