JSW ENERGY
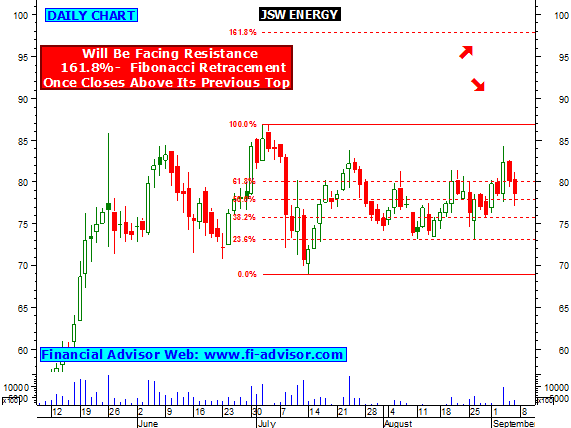
- JSW ENERGY is moving in a range bound zone , chart indicates we can see sharp action in this stock when it comes out from its range bound zone, upper side stock will find strong trend line resistance @ 84.50 and 87, once JSW ENERGY closes and stays above 87 then sharp move is expecting for next few trading days by bulls, as shown in chart no1.
- Intraday share trading tips - close watch once stock starts trading above 84.50 during trading hours, if holds above 84.50 then intraday bulls action is expecting.
- Suggested Reading - FORTIS HEALTH CARE has formed triangle formation, sharp move expecting when it comes out from its pattern.
- As per graph no2, from last 3 times stock is bouncing back from 100 DMA , so as long as JSW ENERGY holds above it will be favored by bulls, but if stock closes below 100 DMA then stock will show first sign of weakness , at present stock major trend indicator like "MACD" and "Stochastic Oscillator" is moving in a positive zone, this view indicates that as long as stock moving in +ve zone stock price can get improve from current levels.
- Suggested Article - How Stock Market Works.
- If stock moved up from current levels, and closes and stays above its resistance @ 87 then JSW ENERGY will find next strong resistance around 97 its 161.8% fibonacci retracement, close watch.
- Click here to see all the free trading reports (tips) published by us on JSW ENERGY.
- Stock Trading Tips.


No comments:
Post a Comment