Showing posts with label mahindra and mahindra (M&M). Show all posts
Showing posts with label mahindra and mahindra (M&M). Show all posts


M&M stock tips and share market tips on Indian stock market updated for 01st March 2016, Tuesday.

MAHINDRA AND MAHINDRA
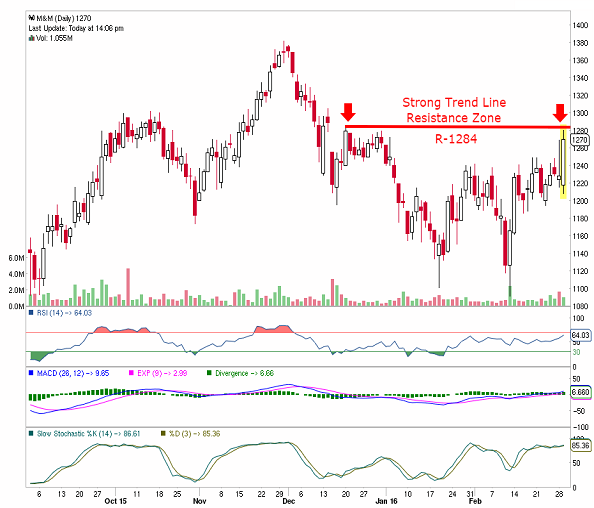
M&M finding strong trend line resistance at current levels, bulls action can be seen once it closes and holds above its trend line resistance @ 1284.
Suggested reading - NSE futures options contracts lot size.
M&M free technical analysis of stock charts updated for 18th November 2015, Wednesday.
MAHINDRA AND MAHINDRA

Stock finding strong trend line resistance around 1301, bulls will be favored once it closes and holds above its trend line resistance.
Visit link to see more stock charts.
Intraday M&M looks good if it holds above 1301.
Will find resistance around 1315, 1323.
S.L - 1293.
Mahindra and mahindra stock market tips updated on 20th June 2015, Saturday.
MAHINDRA AND MAHINDRA

M&M free stock market tips technical chart indicates that stock has formed head and shoulder pattern in daily chart and stock is now on the verge of bullish breakout as it is now finding strong trend line resistance at current levels.
Once stock closes and holds above its resistance zone then further bulls action can be seen in M&M. But if fail to hold above then correction can be seen from current levels.
Suggested article - Analysis on Nasdaq stock chart pattern.
M&M moving in a range bound zone, sharp movement expecting once it closes and holds below its pattern.
MAHINDRA AND MAHINDRA

- Stock moving in a range bound zone, chart indicates as long as it is moving in between its pattern trend will be mix.
- Once stock closes below 1195 its support, then further price fall can be seen in coming days.
- Stock also finding 200 days moving average support at current levels, M&M will favor bears once it starts trading below 200 DMA. Close Watch.
- National Saving Certificates.
MAHINDRA AND MAHINDRA moving in range bound zone.
MAHINDRA AND MAHINDRA

- Stock moving in range bound zone , this indicates as long as stock moving in between in range then trend is not clear.
- Stock also moving up from 200 DMA this will favor bulls as long as stock holds above.
- Even stock major trend indicator "MACD" is moving in zig zag mode, this indicates trend is not clear.
- On upper side stock will find resistance around 1336 and stock will find support around 1200. Close Watch.
M&M Share market tips

Mahindra And Mahindra


- Stock coming down from 61.8% fibonacci retracement resistance zone chart indicates as long as stock holds below further weakness can be seen.
- Stock is also facing 200 DMA support at current levels , once closes and holds below then further weakness can be seen.
- On down side stock will find trend line support around 1230, 1221.50 and 1210, once stock breaks its line support then further price fall can be seen in M&M.
M&M showing weakness below 1221.50.

MAHINDRA AND MAHINDRA


- M&M coming down from 50% fibonacci retracement resistance zone.. chart indicates as long as stock holds below bears will be favored.
- Chart also indicates stock coming down from 50 DMA, as long as stock holds below further price fall can be seen.
- According to technical chart no3 Once stock starts trading below 1221.50 its strong trend line support then further weakness is expecting. Close Watch.
M&M equity tips, Stock to favor bulls above 1400.

MAHINDRA AND MAHINDRA (M&M)


- M&M holding above 161.8% fibonacci retracement support zone, will favor bulls as long as holds above.
- Equity also moving up from 50 DMA, as long as holds above bulls will be favored.
- Stock major trend indicator stochastic oscillator have now turned +ve this indicates stock price can move up from current levels. Close Watch stock will favor bulls once stock closes and holds above 1400.
- Equity tips.
M&M Share Tips, Technical Analysis Chart, Intraday Stock Trading Graph Advice - Stock made a bullish breakout, further buying expecting as long as it holds above it previous top. (Updated On 12th August 2014, Tuesday).
MAHINDRA AND MAHINDRA (M&M)


- As per previous report published on M&M, stock gave a strong up move after breaking its major resistance of 1270. (Click here to see past report published by us on M&M).
- Now daily chart indicates stock has made a bullish breakout as it has now closed above its major resistance of 1270, chart indicates as long as stock holds above 1270 it will be favored by bulls and further up move is expecting. Chart also indicates stock is moving up from 50 days moving average as shown in graph no 1.
- Suggested Reading - MARUTI SUZUKI is on the verge of bullish breakout, currently facing strong resistance around 2675.
- If M&M moves up from current levels then stock will find next resistance around 1355 its 161.8% fibonacci retracement.
- As per graph no 3, stock has now come out from its down channel formation, this indicates further strength for M&M. Even stock major trend indicator like MACD and stochastic oscillator is now moving in positive zone, this indicates stock to move up further.
- Click here to see all the free trading reports (tips) published by us on M&M.
- Free tips on shares.
MAHINDRA AND MAHINDRA (M&M) Share Tips, Technical Analysis Chart, Stock trading Graph - M&M is on the verge of bullish breakout above 1225, Will favor bulls as long as holds above. (Updated On 31st July 2014, Thursday).

MAHINDRA AND MAHINDRA (M&M)


- M&M is moving in a down channel formation and daily chart indicates stock is on the verge of bullish breakout , Once stock closes above 1225 and stays above then stock will favor bulls.
- Intraday close watch once stock starts trading above 1225, If stays above 1225 in intraday then bulls to show some action in M&M
- Suggested reading - KOTAK MAHINDRA BANK has formed double bottom bullish formation.
- Daily chart also indicates stock in moving up from 50 days moving average as shown above in chart no. 2. As long as holds above stock will favor bulls. On Upper side M&M will find strong trend line resistance around 1251, 1270.
- If stock moved up from current levels and closes above 1270 then stock to get more strength from its indicators and further up move is expecting, and stock will find next strong resistance around 1350 its 161.8% fibonacci retracement. Close Watch.
- Click here to see all the trading reports (tips) published by us on M&M (as per technical analysis point of view).
Subscribe to:
Posts (Atom)