Advertisement

Showing posts with label bharat petroleum (BPCL). Show all posts

BPCL free technical analysis of stocks and stock charts - updated for 14th January 2016, Thursday.


BPCL free technical analysis of stocks indicates that it has stuck in a range bound zone, trend will be mix as long as it holds in between its range.

Close watch stock is now finding strong support at its previous bottom once it closes and holds below then price fall can be seen in coming days.

MACD and Slow Stochastic is now moving in -ve zone this will favor bears.

Visit our blog tips on share daily for more free share market tips on Indian stocks.

BPCL free share market tips and Indian stock tips updated for 02nd December 2015, Wednesday.

BPCL

Stock has closed above its strong trend line resistance zone, technical indicates further bulls action can be seen as long as stock holds above its previous top.
Stock has also formed long bullish candlestick pattern with increase in trading volumes this will favor bulls.

Visit link to see more trend signals charts.

BPCL trading tips and stock tips on share market updated for 23rd November 2015, Monday.

BPCL

BPCL moving up from strong trend line support zone this will favor bulls, technical indicates stock is now finding strong trend line resistance at current levels at its previous top @ 925.50.
Further price rise can be seen once BPCL closes and holds above its trend line resistance zone @ 925.50.

Visit link for free currency trading tips fi-advisor.com-currency-trading-tips.

Intraday BPCL looks good if it holds above 925.50.
Will find resistance around 930, 933.
S.L - 922.50.

BPCL free buying selling trading ideas and forecast updated for 18th November 2015, Wednesday.

BPCL

BPCL witnessing selling pressure from strong trend line resistance zone bears will be favored, further price fall can be seen once stock closes and holds below its trend line support zone @ 872.


Intraday BPCL looks weak if it holds below 872.
Will find support around 867, 865.
S.L - 875.

BPCL free trading tips and free intraday tips updated for 26th October 2015, Monday.


Stock is moving in a range bound zone technical indicates once it closes and holds above its range @ 926 then further bulls action can be seen in coming days.
As long as it is trading in between its range trend will be mix with no clear direction.

Intraday stock looks good above 926, will find resistance around 932, 935.

Visit link to read article on nifty future.

BPCL free intraday trading tips and stock tips updated for 22nd September 2015, Tuesday.


BPCL finding strong 50% fibonacci retracement resistance around 892.50, technical indicates further price rise can be seen once stock closes and holds above its resistance zone as shown in above technical image.

Free intraday tips updated for 22nd September 2015, Tuesday.

BPCL looks good above 892.50.
Will find resistance around 898, 903.
S.L 890.

BPCL stock tips updated on 05th July 2015, Sunday.


BPCL finding strong resistance at current levels, bulls will be favored once BPCL closes and holds above and once it holds above then further bulls action can be seen.
If fails to hold above then some correction can be seen in coming days.
Stock has also formed doji candle this indicates change of trend with some sharp action can be seen in coming days.

Visit link below for more stock tips on Indian stock market :-

BPCL technical analysis chat updated on 10th June 2015, Wednesday.


BPCL technical analysis chart indicates that it has formed head and shoulder pattern in daily chart and earlier it had made a bullish breakout, now its previous resistance is now acting as a major support for bpcl.
So as long as it hold above bulls will be favored and further price rise action can be seen.

Suggested article - Explain term financial markets.

BPCL technical analysis chart updated on 02nd June 2015, Tuesday.


BPCL technical analysis chart indicates that it has closed above its major trend line resistance as shown in above graph. As long as BPCL holds above its previous top bulls will be favored and further price rise can be seen in coming days.

BPCL stock market chart updated at 18th May 2015, Monday.


BPCL has formed head and shoulder pattern in daily charts, technical indicates it moved up from its strong support zone i.e 200 days moving average and trend line support zone at indicate in above stock market chart.
Currently BPCL is finding strong neckline resistance at current levels, this indicates once stock closes and holds above then bulls will be favored and further price rise can be seen in BPCL, weakness expecting if failed to holds above its neckline.
Visit link below to read article on what is stock exchange:-

BPCL trading forecast updated on 12th May 2015, Tuesday.


Stock has formed head and shoulder pattern in daily chart technical indicates stock can see some trading action once it closes above its neckline of if it closes below its trend line support zone then weakness expecting till then trend will be mix. Click here to read article on various methods of trading in stock markets.

Chart also indicates that BPCL is facing 200 days moving average support, once it starts trading below then bears will be favored as per moving average studies.

BPCL Stock Tips, Technical chart Updated On 31st March 2015, Tuesday.


Stock has formed head and shoulder pattern in daily chart technical indicates BPCL will be favored by bulls once it closes and holds above its previous top, intraday action can be seen once it holds above its previous top during market hours.

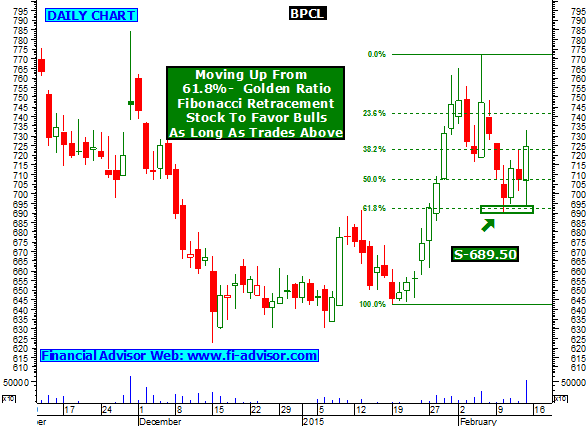
BPCL moving up from golden ratio support zone, will favor bulls as long as holds above 689.50.


BPCL
Charts updated on - 23rd February 2015.


  • Stock moving up from strong golden ratio support zone as shown above, this indicates as long as BPCL holds above 689.50 bulls will be favored and further price rise can be seen.
  • We can see some weakness in BPCL once stock closes and holds below 689.50. Close Watch.

BPCL facing strong golden ratio support at current levels in Hourly chart @ 689.


BPCL
Charts updated on - 11th February 2015.


  • Stock facing strong golden ratio support at current levels in hourly chart, this indicates as long as BPCL holds above 689 bulls will be favored.
  • Stock also holding above 200 hours moving average, as long as holds above bulls will be favored.
  • Can see some intraday weakness once BPCL starts trading below 689. Close Watch.
  • Click here to read article on Golden rules in stock market trading.

BPCL is on bull move and now heading to test its strong trend line resistance around 785.


BPCL


  • Stock moving up from strong 200 days moving average and trend line support zone, chart is currently on bullish zone as long as it holds above.
  • Close watch BPCL will now find strong trend line support zone around 785 and 810, once stock closes and holds above its trend line resistance then further price rise can be seen in coming days. Close Watch.
  • Click here to read about - Different methods of buying in stock market.

Advertisement

What is Intraday Tips ?

Q. What is Intraday Tips / Inraday Trading / Delivery trading.

A. There are basically two types of trading on stock market--
1- Delivery
2- Intraday

Delivery trading is one in which shares are bought and can only be sold after they are delivered by the broker.that means that they cannot be sold the same day , and delivery takes two to three days after they are bought and then they are ready to be sold.

Intraday trading which takes place for that very particular day and there is no delivery..they can be bought and sold the same day...and are automatically sold at the end of the trading session if you have not sold it by yourself during the trading session. The person who suggest such types of forecast is called

Intraday Tips

.