Showing posts with label aban offshore. Show all posts
Showing posts with label aban offshore. Show all posts

ABAN Offshore free Bombay stock exchange stock tips - updated for 12th January 2016, Tuesday.


Stock has formed double top pattern in daily chart, trend will be mix as long as stock holds in between its pattern.
Down side will find support around 205, will favor bears once it closes and holds below its support zone as shown in above image.
Suggested reading - Visit link to read article on Bombay stock exchange.
Aban offshore free trading tips and stock tips updated for 18th November 2015, Wednesday.
ABAN OFFSHORE

Aban offshore free trading tips and stock tips updated for 18th November 2015, Wednesday.
ABAN OFFSHORE finding strong trend line resistance at current levels, bulls action can be seen once it closes and holds above its trend line resistance @ 220.
Intraday ABAN OFFSHORE looks good if it holds above 220.
Will find resistance around 223.50, 225.
S.L - 218.
Will find resistance around 223.50, 225.
S.L - 218.
Aban Offshore BSE Sensex stock tips and share tips updated for 06th November 2015, Friday.

Aban offshore has formed triangle pattern in daily chart, technical indicates sharp movement can be seen once it comes out from its pattern till then its range will bee narrow in coming days.
On down side stock will find support around 215, weakness can be seen once it closes and holds below 215.
Intraday stock looks weak below 215, will find support around 211.50, 210.
Visit link to see article on what is sensex.
Aban offshore free stock market tips and technical charts updated for 24th August 2015, Monday.

Aban offshore witnessing selling pressure from 50 DMA, bears will be favored as long as stock stays below 50 DMA, on down side stock is now finding strong support around 273, stock can see some further weakness once it closes and holds below 273.
Free intraday stock tips updated for 24th August 2015, Monday.
Aban offshore looks weak below 273.
Will find support around 268, 265.
S.L 275.
Visit link to view article on what is block deals.
Aban offshore free share market tips updated on 13th August 2015, Thursday.

Aban offshore witnessing selling pressure from 50 DMA, technical indicates this will favor bears as long as it holds below.
Further price fall can be seen once stock closes and holds below 276 (its previous bottom as shown in above image).
Free Indian share market tips updated for 14th August 2015, Friday.
Aban offshore looks weak below 276.
Will find support around 272, 270.
S.L 278.
Visit link to read article on National stock exchange of India.
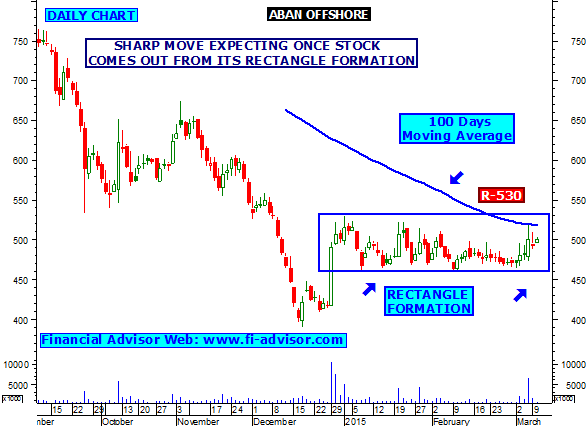

ABAN OFFSHORE coming down from strong resistance zone, further weakness can be seen in coming days.
ABAN OFFSHORE

- Stock currently coming down from golden ratio resistance zone @ 530, this indicates further weakness can be seen as long as stock trades below.
- Stock also coming down from strong trend line and 50 DMA resistance zone, this indicates bears will be favored. Close Watch.
ABAN OFFSHORE facing strong trend line resistance around 530.

ABAN OFFSHORE

- Stock facing strong golden ratio resistance around 530, chart indicates we can see come action once stock closes and holds above 530.
- Stock also finding golden ratio resistance at current levels, once closes closes and holds above then further strength can be see in Aban offshore.
- Aban also finding 50 days moving average resistance , as long as trades below bears will be favored once it closes and holds above 50 DMA then further strength can be seen. Close Watch.
- Visit this blog daily for best intraday tips on Indian stock market.
ABAN OFFSHORE Free Share Tips, Free Stock Tips

ABAN OFFSHORE


- Stock has formed head and shoulder formation and on the verge of bearish breakout.
- Stock also coming down from 38.2% fibonacci retracement resistance zone this will favor bears.
- Technical chart also indicates that its major trend indicator like "MACD" and "Stochastic Oscillator" is moving in -ve zone this indicates further price fall can be seen once stock closes and holds below 533.50.
ABAN OFFSHORE Share Tips, Technical Analysis Chart, Intraday Stock Trading Idea Tips Graph Advice - Stock coming down from 50 DMA, and now facing golden ratio support, will favor bears once closes below 668. (Updated on 23rd September 2014, Tuesday).

ABAN OFFSHORE


- Stock facing strong golden ratio support @ 668, will favor bears once closes and stays below 668. Intraday closes watch once ABAN stays trading below 668, if holds below then intraday weakness is expecting.
- Chart also indicates that stock coming down from 50 DMA, this will favor bears as long as holds below 50 DMA.
- Even chart major trend indicator like "MACD" and Stochastic Oscillator" is moving in -ve zone as shown above. This indicates stock can see some price decline in coming days.
- Free share market tips.
ABAN OFFSHORE Share Tips, Technical Analysis Chart, Intraday Stock Trading Graph Advice - Stock is moving in a range bound zone and heading to test its support, Close watch weakness expecting once Aban Offshore closes below 687. (Updated on 16th September 2014, Tuesday)
ABAN OFFSHORE


- As per previous report published on ABAN OFFSHORE, Stock gave a intraday move after breaking its resistance @ 763, made a intraday high around 775, but failed to close above 763. (Click here to see previous report published on ABAN OFFSHORE).
- Now current technical chart no1 indicates that stock is moving in a up channel formation, as long as stock trades in between channel pattern it will be favored by bulls, sharp weakness expecting once it comes out.
- As per chart no2, stock is facing is again going to test its 50% fibonacci retracement support around 687, if stock closes and stays below 687 then further weakness is expecting.
- Suggested Reading - Investing in penny stocks.
- Intraday Tips - if stock starts trading below 687 during trading hours then intraday weakness is expecting.
- Chart no3 indicates that 50 DMA is playing a important role earlier it was acting as a support for Aban Offshore, now it is acting as a major resistance, as long as stock trades below 50 DMA bears will be favored and we can see further price fall in Aban.
- Also See - DREDGE CORPORATION has formed doji formation in monthly chart, sharp move expecting in coming days.
- According to to chart no4, stock had formed small range bound zone at current levels, when it comes out then sharp move is expecting. Upper side breakout level is 775 and downside is 687. Close watch as long as trades in between its range stock will remain Zig Zag.
- Click here to see all the free trading reports (tips) published by us on ABAN OFFSHORE.
- Stock market advice.
ABAN OFFSHORE Share Tips, Technical Analysis Chart, Intraday Stock Trading Graph Advice - Stock moving in a Small range bound zone, can see some movement once close above 763. (Updated on 04th September 2014, Thursday).

ABAN OFFSHORE


- As per previous report published on ABAN OFFSHORE, stock has shown intraday move after breaking its resistance @ 804 and made a high @ 821, but failed to move more and stock fell down after that. (Click here to see previous report published on ABAN OFFSHORE).
- Current chart indicates stock is still holding its 50% fibonacci retracement support as long as stock holds above 687 bulls will be favored , but once stock close and stays below 687 then bears will get active and we can see some further weakness in Aban Offshore.
- Suggested Reading - ADANI ENTERPRISES facing strong trend line resistance at current levels, will favor bulls once stock closes above.
- As per graph no2, stock 50 days moving average was paying an important role, last 4 times stock bounced back from 50 DMA, but this time it is trading below 50 DMA , stock must trades above its 50 DMA to favor bulls, once holds above 50 DMA then can see some activity in Aban Offshore. Close Watch.
- Suggested Article - What is Nifty and Nifty futures.
- As per graph no3, stock is stuck in small range bound zone, this indicates that we can see some sharp action once stock comes out from its range, upper side will find resistance around 763 and down side will find support around 687. Close watch if stock closes and stays above 763 then can see some bulls action for few trading days.
- Intraday trading tips - If Aban hold above 763 during market hours then intraday bulls action is expecting.
- Click here to see all the free trading reports (tips) published by us on ABAN OFFSHORE.
- Share market trading tips.
ABAN OFFSHORE Share Tips, Technical Analysis Chart, Stock trading Graph - Stock moving up from strong support, Further buying expecting once stock closes above 804. (Updated on 05th August 2014, Tuesday).
ABAN OFFSHORE


- As per previous report published on ABAN OFFSHORE stock failed to break its support and stock has bounced back. (Click here to see previous report on Aban Offshore).
- Now daily chart indicates stock is moving up from 50% fibonacci retracement support zone, as long as stock holds above Aban will favor bulls.
- Stock also moving up from 20 days moving average, this indicates as long as holds above Aban will favor bulls.
- Daily chart also indicates stock is currently facing strong 38.2% fibonacci retracement resistance around 804 if closes above and stays above 804 then stock can test its next resistance around 827 & 855 its fibonacci retracement resistance, as shown in chart no 3.
- Intraday close watch once ABAN starts trading above 804, if stays above then intraday action is expecting by bull. Close Watch.
- Suggested Reading - IGL on the verge of bullish breakout.
- Click here to see all the trading reports (tips) published by us on ABAN OFFSHORE (as per technical analysis point of view).
ABAN OFFSHORE Share Tips, Technical Analysis Chart - Stock facing strong support at current levels , selling expecting if closes below 714. (Updated for 28th July 2014, Monday).

ABAN OFFSHORE


- ABAN OFFSHORE is witnessing selling from higher levels (38.2% fibonacci retracement) this will favor bears... Stock currently facing 50 days moving average support as shown above... this indicates if stock closes below its moving average and stays below then Aban to give further weakness.
- Daily chart also indicates stock is facing 50% fibonacci retracement support around 714, if stock closes below 714 and stays below then stock to favor bears for next 1-2 trading days. if falls then stock will find next strong support at golden ratio 61.8% fibonacci retracement around 670 (as shown above in chart).
- Intraday close watch, if ABAN starts trading below 714, and stays below with volumes then intraday weakness is expecting.
- Daily chart also indicates that ABAN MACD indicator is moving in a -ve zone this will too favor bears. close watch.
- Click here to see all the reports (tips) published by us on ABAN OFFSHORE (as per technical analysis point of view).
Tips On Share - ABAN OFFSHORE facing strong resistance in monthly chart. (Updated On 02nd July 2014, Wednesday).


- ABAN OFFSHORE moving up from strong 38.2% fibonacci retracement, daily chart indicates stock will now face resistance around 781 (its previous top). If stock closes above and sustains above its previous top and further up move is expecting in ABAN OFFSHORE.
- (Short term trend) - Weekly chart indicates that stock is heading for its 161.8% fibonacci retracement around 800 indicates caution for short term traders. Need to watch how aban will react on its resistance.
- (Long term trend) - Monthly chart indicates that stock is currently facing strong resistance but once it closes above its 38.2% fibonacci retracement in monthly chart then further move is expecting in aban offshore in coming months. Close Watch.
- Stock was on news - Macquarie upgraded the stock to "outperform" from "underperform" and raised its target.


Subscribe to:
Posts (Atom)