- BIOCON is moving in a range bound zone from last few weeks, stock is moving in a rage zone of 510 -514 as shown above, stock is today trying to come out from its range. If BIOCON closes above 514 and stays above then further up move is expecting in BIOCON.
- Weekly chart is indicating stock has formed double bottom bullish formation and is on the verge of breakout above same level @ 514, If stock closes above 514 in weekly chart and remains above then stock is looking bullish for its short term.
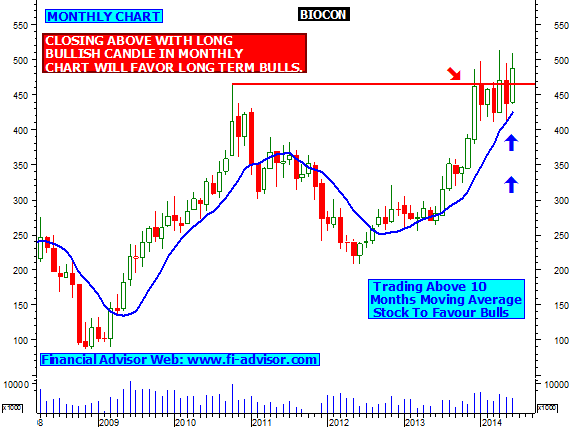
- Monthly chart indicates that Stock will turn bullish for long term if it closes above trend line resistance with a long bull candle which is currently in progress for the month of June. Stock also moving up from 10 months moving average which will favor bulls to take stock further up in coming months.
Next Stock update at 25th June 2014, Wednesday, Around 2:00 pm


