CESC LTD
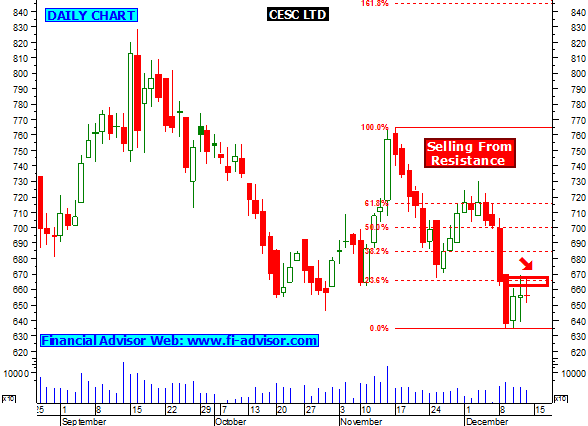
- Stock made a bearish breakout this indicates further weakness can be seen as long as stock trades below its trend line as shown in chart no1.
- Technical also indicates stock is currently trading coming down from 23.6% fibonacci retracement, this will favor bears.
- If stock falls further then CESC will find next strong trend line support around 603, 585 and 573.


No comments:
Post a Comment