- SHIPPING CORPORATION OF INDIA (SCI) moving up from 38.2% fibonacci retracement and 20 days moving average as shown above, daily chart indicates as long as stock hold above stock will favor bulls and upper side will face resistance around 73.
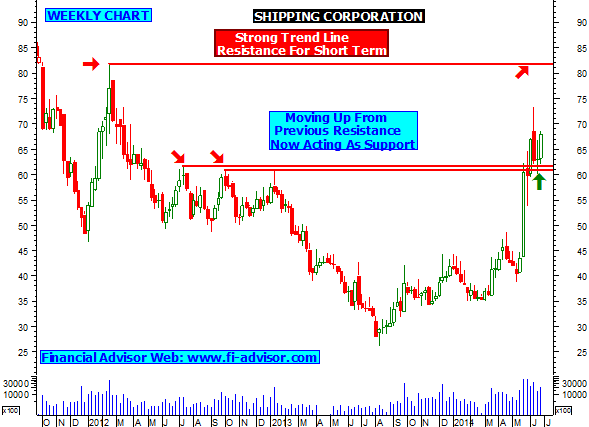
- (Short term trend) - Weekly chart of SCI indicates that stock moving up from strong trend line support as shown above stock to move further as long as it holds its support mention above in weekly chart, stock will favor short term bulls and on upper side will find resistance around 82.
- (Long term trend) - Monthly chart indicates that stock is now trading around 23.6% fibonacci retracement and also heading for 50 months moving average if stock closes above and starts trading above resistance in monthly chart then long term trend looks bullish and will find next resistance around 95 & 115 (38.2% & 50% fibonacci retracement). Close Watch.
Next Stock Will Update On 26th June 2014, Thursday Around 11:00 am


