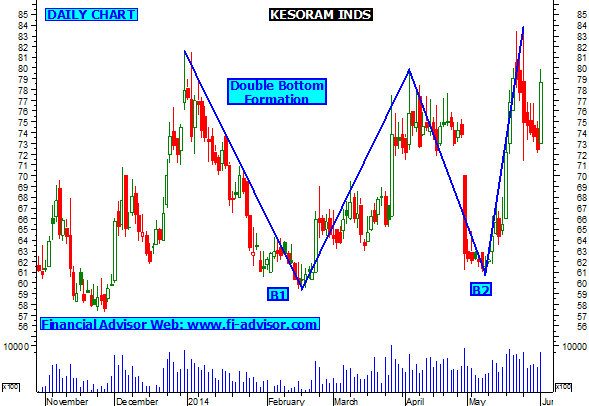
- KESORAM INDS had formed double bottom formation in daily chart as shown above.
- Stock is now facing fibonacci retracement golden ratio resistance around 84.
- Stock is also facing 100 weeks moving average at current levels, close watch once crosses resistance then kesoram inds will favor bulls.
For more stock market tips on shares on indian stock market visit our blog daily.


