Showing posts with label allahabad bank. Show all posts
Showing posts with label allahabad bank. Show all posts


Allahabad Bank free nifty nse tips and stock tips updated for 06th November 2015, November.

ALLAHABAD BANK
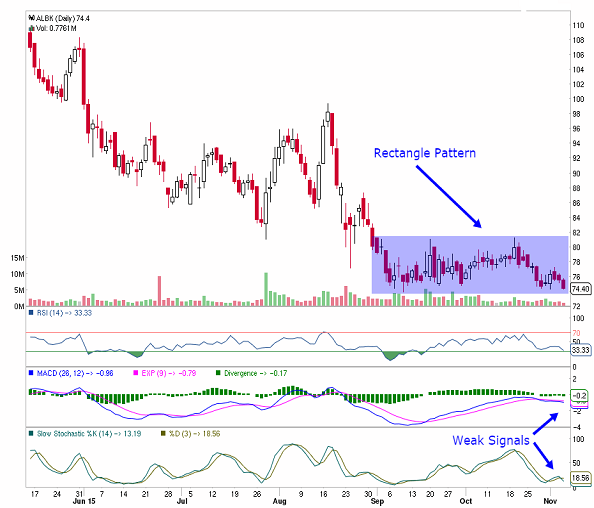
Stock has formed rectangle pattern in daily chart, technical indicates bears will be favored once stock closes and holds below 73.90.
As long as stock holds in between in it range trend will be mix with no clear direction.
Stock major trend indicators showing weak signals this will favor bears.
Intraday stock looks weak below 73.90, will find support around 72.50, 71.50.
Visit link to read article on what is nifty.
Allahabad bank stock tips and nse tips updated on 18th August 2015, Tuesday.

Allahabad bank finding strong resistance around current levels @ 97.20, technical indicates bulls action can be seen once it closes and holds above its resistance zone as shown in above technical graph.
Free intraday stock tips updated on 18th August 2015. Tuesday.
Intraday Allahabad Bank looks good above 97.20.
Will find resistance around 98.50, 99.
S.L 96.50.
Visit link to read article on Online day trading guide.

ALLAHABAD BANK Intraday tips
ALLAHABAD BANK


- Stock has formed head and shoulder formation formation and stock moving up from neckline support @ 112, bulls will be favored as long as stock holds above 112.
- Stock also trading up from 100 DMA, this will favor bulls.
- If stock moves up further then will find resistance around 121.50, 124 and 127, levels as per fibonacci retracement.
ALLAHABAD BANK Intraday trading strategies, Intraday trading tips.

ALLAHABAD BANK


- Stock has formed head and shoulder formation and made a bullish breakout, will favor bulls as long as stock holds above.
- Stock also moving up from 100 DMA , this will favor bulls for further price rise.
- If stock moved up further from current levels then will find next strong resistance around 148 as shown in chart no3.
ALLAHABAD BANK Share Tips, Technical Analysis Chart, Intraday Stock Trading Idea Tips Graph Advice - Stock coming down from resistance, and now at support, weakness expecting once ALLAHABAD BANK closes below 112. (Updated on 24th September 2014, Wednesday).

ALLAHABAD BANK


- Stock currently facing golden ratio support @ 112, close watch if stock closes below 112 then weakness expecting for next few trading days. Intraday close watch once stock starts trading below 112 during market hours, if holds below 112 then intraday weakness expecting.
- Stock also trading below 100 DMA this will favor bears, and also stuck in a range bound zone , whenever stock comes out from its range sharp movement expecting.
- According to stock analysis chart no3, stock is coming down from strong resistance zone, and on down side will find support around 112 and 91. Close Watch.
ALLAHABAD BANK Share Tips, Technical Analysis Chart, Intraday Stock Trading Graph Advice - Stock moving up from support and stuck in a range bound zone, close watch bulls will be favored once Allahabad Bank closes above 128. (Updated on 19th September 2014, Friday).
ALLAHABAD BANK


- Stock moving up from golden ratio support, will favor bulls once closes and stays above 128, Intraday bull action can be see once Allahabad Bank holds above 128 during trading hours.
- Stock moving in a range, and also above 100 DMA, once breaks its range of upper side @ 128 and holds above then some action is expecting.
- Stock major indicator "MACD" and "Stochastic Oscillator" is moving in +ve zone, some further price improvement can be seen as per trend indicators.
- As per monthly chart, Allahabad bank moving in a down channel formation, once closes and stays above 150 then stock to favor short-long term traders.
- Free stock market tips.
ALLAHABAD BANK Share Tips, Technical Analysis Chart, Intraday Stock Trading Graph Advice - Stock facing strong support at current levels, weakness expecting once stock closes below 112. (Updated on 30th August 2014, Saturday).

ALLAHABAD BANK


- As per previous report published on Allahabad bank stock failed to closed above its range bound zone @ 126 , stock gave some intraday move and fell down after that and still on down move and so far made a low @ 112.50. (Click here to see previous report published on Allahabad Bank).
- Now current chart indicates that stock is facing strong golden ratio support around 112 , once stock closes below 112 and stays below then further weakness is expecting for next few trading days.
- Intraday stock tips , close watch once Allahabad Bank starts trading below 112 during trading hours, and if holds below with volumes then intraday weakess is expecting.
- As per graph no2, stock is moving in a range bound zone, once stock comes out from its range then sharp move is expecting, Technical chart also indicates that stock is trading below 100 days moving average, as long as stock holds below it will be favored by bears, once stock starts trading above 100 DMA it will shown first sign of strength. Chart also indicates that stock earlier made a false bullish breakout, but failed to close above.
- Suggested Article - NSE trading and clearing holidays for year 2014.
- As per graph no 3, once stock closes below its recent bottom @ 112 and starts trading below then will find next strong support around 103 its 161.8% fibonacci retracement.
- Suggested Reading - RELIANCE CAPITAL trading below its major support, further weakness is expecting.
- As per graph no4, stock is now trading below is long bullish trend line support , by this stock made a bearish breakout and its now showing a sign of weakness.
- Click here to see all the free trading reports (tips) published by us on ALLAHABAD BANK.
- Free tips on share.
ALLAHABAD BANK Share Tips, Technical Analysis Chart, Intraday Stock Trading Graph Advice - Stock is facing strong support at current levels, buying expecting once stock closes above 126. (Updated On 13th August 2014, Wednesday).
ALLAHABAD BANK


- As per previous report published on ALLAHABAD BANK, stock has shown weakness after breaking its major support of 126 and has made a low around 112. (Click here to see past report published on ALLAHABAD BANK).
- Now daily chart indicates that Allahabad Bank is moving up from strong support around 112 its golden ratio 61.8% fibonacci retracement. So as long as stock holds 112 stock will be favored by bulls and some strength is expecting in ALL BANK. but once stock closes below 112 and stays below then further weakness is expecting.
- Suggested Reading - MAHINDRA CIE AUTOMOTIVE facing strong support at current levels, Stock to favor bears if closes below its support.
- Daily chart also indicates that stock has formed range bound zone at current level, this indicates once stock comes out from its range bound zone then sharp move is expecting. Chart no 2 also indicates that stock is facing 100 days moving average support at current levels, as long as stock holds above 100 DMA it will be favored by bulls.
- If stock move up from current levels then will find next strong resistance around 126, 129 and 133 its fibonacci retracement as shown in graph no3. Close Watch.
- Click here to see all the free trading reports (tips) published by us on ALLAHABAD BANK.
- Free tips on share.
ALLAHABAD BANK Stock Tips - Stock facing strong support around 126 in hourly and daily chart. (Updated On 09th July 2014, Wednesday).


- (Intraday Trading Idea) - ALLAHABAD BANK shown strong selling in hourly chart from 142 levels, Close watch stock is facing strong trend line support in hourly chart, which indicates if Allahabad Bank breaks 126 level with volumes and must stays below 126 then we can see further selling (intraday) in stock.
- (1-2 Days trading idea) - Daily chart indicates stock is currently facing strong 38.2% fibonacci retracement support around 126, if stock closes below its support and stays below 126 then can see further selling for next 1-2 days. Will find next support around 50% fibonacci retracement around 120. Daily chart also indicates stock is facing 50 days moving average support at current levels, if stays below then will favor bears.
- (Short term view) - Weekly chart indicates stock is currently trading below 23.6% fibonacci retracement indicating weakness and will find support around 120 - 38.2% fibonacci retracement.
Subscribe to:
Posts (Atom)