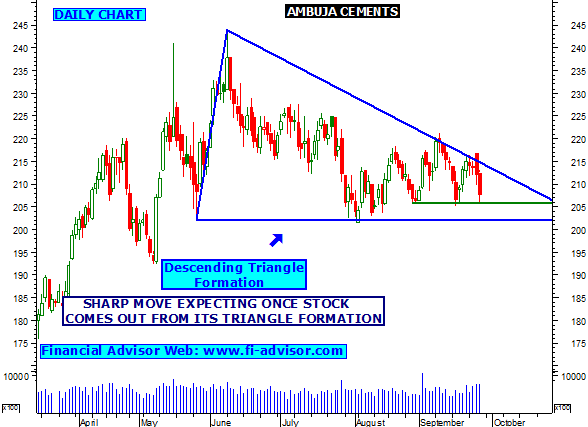
AMBUJA CEMENTS
- AMBUJA CEMENTS has formed descending triangle formation in daily chart, indicates once stock closes and stays below 201.50 then further weakness is expecting. stock will also test minor support @ 205, weakness expecting once stays below.
- If stock falls below 201.50 and stays below then Ambuja Cements will find next support around 192.
- Technical Chart also indicates that stock coming down from 50 DMA and its major indicator "MACD" is moving in -ve zone and below level zero this will favor bears.
- Also see - Nifty Futures technical analysis.


No comments:
Post a Comment