Advertisement

BATA INDIA Share Tips, Technical Analysis Chart, Intraday Stock Trading Graph Advice - Stock currently facing strong resistance around 1360, Once closes above BATA will favor bulls, Till then stock can see come correction from current levels. Updated On 09th September 2014, Tuesday).


BATA INDIA LTD


  • As per current stock analysis chart no1, BATA is moving in a up channel formation , as long as stock moving in channel formation it will be favored bu bulls, but once Bata breaks its up pattern on down side then weakness is expecting.
  • As per graph no2, 100 days moving average is playing an important role from last 3 time we have witnessed big bull rally as soon as stock touched 100 DMA, on upper side stock is finding strong trend line resistance around 1360, once stock closes above 1360 and stays above then stock looking bullish for next few trading days.
  • As per graph no3, if stock moves up from current levels and closes above 1360 then Bata will find next resistance around 1470 its 161.8% fibonacci retracement.
  • But if Bata falls from current levels then stock will find strong fibonacci retracement support around 1315, 1290, 1270 and 1250 as shown in chart no4.
  • Click here to see all the free trading reports (tips) published by us on BATA INDIA.
  • Equity trading tips.

ADANI ENTERPRISES Share Tips, Technical Analysis Chart, Intraday Stock Trading Graph Advice - Stock facing strong trend line resistance at current levels, Will favor bulls once closes above 525, Till then stock can show some correction. (Updated on 09th August 2014, Tuesday).


ADANI ENTERPRISES


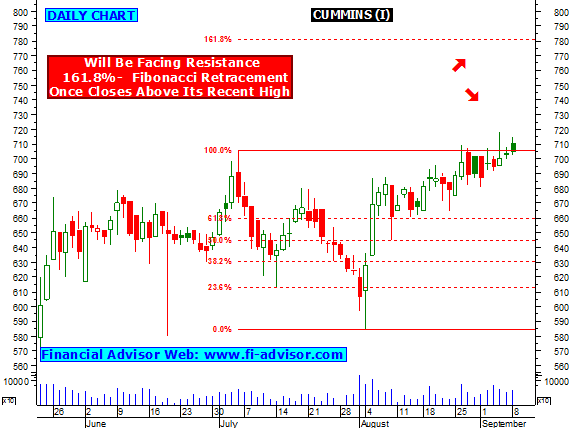
CUMMINS INDIA Share Tips, Technical Analysis Chart, Intraday Stock Trading Graph Advice - Stock facing strong trend line resistance at current levels, will favor bulls once stock closes above its recent high @ 718, Till then Cummins (I) can see some correction. (Updated on 09th September 2014, Tuesday).


CUMMINS INDIA LTD


  • As per previous report published on CUMMINS (I), stock has shown intraday bulls action by breaking its resistance @ 709. After breaking its resistance @ 709 stock made an high @ 718, but failed to closed above its resistance @ 709. (Click here to see previous report published on CUMMINS (I)).
  • As per current stock analysis chart no1, stock is still moving in a up channel formation, so long as it moved in its channel patter bulls will be favored, and on upper side Cummins will find strong resistance around 718 its recent high. Once Stock closes above 718 and stays above then further strength is expecting for next few trading days.
  • As per technical graph no2, stock is trading above its 20 days moving average as long as stock holds above bull will dominate in Cummins (I). But once stock closes below 20 DMA it will show first sign of weakness. Close Watch.
  • Technical chart no3 also indicates that 100 DMA is also playing an important , from last 5 times stock bounced back from 100 DMA, as long as stock holds above, short-long term traders will be favored. 
  • As per chart no4, If stock moved up from current levels and closes and holds above 718 then will find next strong resistance around 780 its 161.8% fibonacci retracement.
  • But if Cummins (I) falls from current levels then close watch on fibonacci retracement support zone around 686, 667, 653 and 636 as shown in chart no5.
  • Click here to see all the free trading reports (tips) published by us on CUMMINS INDIA.
  • Equity tips.

HINDUSTAN COPPER Share Tips, Technical Analysis Chart, Intraday Stock Trading Graph Advice - Stock has formed range bound zone at current levels, sharp move expecting once Hind Copper comes out from its range , levels to watch resistance @ 92.50, support @ 84.50. (Updated on 09th September 2014, Tuesday).


HINDUSTAN COPPER


  • Hindustan Copper moving up from it golden ratio support zone as shown in stock analysis chart no1, This indicates as long stock is holding above its support zone @ 84.50, it will be favored by bulls, but once stock closes below 84.50 and stays below then further weakness is expecting for next few trading days.
  • As per technical chart no2, stock is moving in a range bound zone from last few trading days, this indicates once Hind Copper comes out from its range then sharp move is expecting, levels to watch out for - resistance @ 92.50 and support @ 84.50. Till then stock will remain zig zag with no clear trend.
  • As pe graph no3, if moves up from current levels then Hind Copper will find strong fibonacci retracement resistance around 92.50, 97, 101 and 105. Once closes above 92.50 and if holds above then stock looking bullish for next few trading days.
    • Intraday trading pick - Close watch once Hind Copper starts trading above 92.50, if holds above during market hours then intraday bulls action is expecting in this counter.
  • As per chart no4, stock is holding above 200 days moving average, as long as stock holds above bulls will be favored , but once Hind Copper closes below 200 DMA then bears will be active. Close Watch.
  • Click here to see all the free trading reports (tips) published by us on HINDUSTAN COPPER.
  • Best share market tips.

Advertisement

What is Intraday Tips ?

Q. What is Intraday Tips / Inraday Trading / Delivery trading.

A. There are basically two types of trading on stock market--
1- Delivery
2- Intraday

Delivery trading is one in which shares are bought and can only be sold after they are delivered by the broker.that means that they cannot be sold the same day , and delivery takes two to three days after they are bought and then they are ready to be sold.

Intraday trading which takes place for that very particular day and there is no delivery..they can be bought and sold the same day...and are automatically sold at the end of the trading session if you have not sold it by yourself during the trading session. The person who suggest such types of forecast is called

Intraday Tips

.